
TOWARDS DATA WAREHOUSES FOR NATURAL
HAZARDS
Hicham Hajji, Mohand-Said Hacid, Hassan Badir
Claude Bernard University,LIRIS - UFR d'Informatique
43, boulevard du 11 Novembre 1918
69622 Villeurbanne cedex
France
Keywords: Data warehouse, OLAP, natural hazards management, Geographical Information Systems
Abstract: Data warehousing has emerged as an effective technique for converting data into useful information. It is an
improved approach to integrate data from multiple, often very large, distributed, heterogeneous databases
and other information sources. This paper examines the possibility of using data warehousing techniques in
the natural hazards management framework to integrate various functional and operational data which are
usually scattered across multiple, dispersed and fragmented systems. We present a conceptual data model
for the data warehouse in the presence of various data formats such as geographic and multimedia data. We
propose OLAP operations for browsing information in the data warehouse.
1 INTRODUCTION
Data warehousing is one of the most important
recent developments in the field of information
system (IS). Conceptually, a data warehouse is a
database that collects and stores data from multiple
remote and heterogeneous information sources. The
data warehouse approach presents some advantages
over the traditional on-demand approach
(Theodoratos, 1999):
- The queries can be answered locally without
accessing the
original information sources.
- On-line Analytical Processing (OLAP
) is
decoupled (separated) as much as possible from On-
line Transaction Processing (OLTP).
Data warehousing technologies have already been
success
fully deployed in many industries (in
manufacturing for order shipment and customer
support, in financial services for claims analysis, risk
analysis, in transportation for fleet management, in
telecommunications for call analysis, and in
healthcare for outcomes analysis (Adriaans, 1996).
In this paper, we propose a multidimensional data
m
odel for natural hazard management, and we
propose a query tool that will assist to extract
information and perform analytical operations in
such warehouse environment. To motivate our study
of spatial data warehousing, we examine the
following examples:
Example 1: par
cel-based analysis of damage
assessment. A user may like to view damage
assessment on maps by building, by parcel, or even
like to dynamically drill-down or roll-up along any
dimension to explore desired patterns, such as risky
regions regarding a specific hazards.
Example 2: o
verlay of multiple thematic maps.
There often exist multiple thematic maps in spatial
database, such as altitude map, population map,
flood intensity map etc. By overlapping thematic
maps; one may find some interesting relationships
among altitude and flood intensity.
Paper outline: The paper is organized as follows.
Sect
ion 2 will present data model sources and
proposes a model for the data warehouse. Then, we
present some interesting OLAP operations for data
analysis and exploration of the data cube. We
conclude our work in section 4 by anticipating on
necessary extensions.
415
Hajji H., Hacid M. and Badir H. (2005).
TOWARDS DATA WAREHOUSES FOR NATURAL HAZARDS.
In Proceedings of the Seventh International Conference on Enterprise Information Systems, pages 415-419
DOI: 10.5220/0002519704150419
Copyright
c
SciTePress
Material s
ID
Signification
Floors materials
ID
Signification
Maintenance Sta
t
e
ID
Signification
2 A MULTIDIMENSIONAL
MODEL FOR ANALYSIS
Built Prop
PB_ID
Local Nature
Particular Construction
Cadastral Section
Occupation Nature
Level number
Floor level
Parcel Number
N° Local
Local Type
Total Locative Value
Address
Date of achievement
Habitat Description
Maintenance state
Mater ials
Floors materials
Number of annexes beds
Numbers of chambers
Number of beds
Number of principal beds
Beds a reas
Elevators
Central heating
Eau
Gas
PB_ID
Local Nature
ID
Signification
Parti cular Construct ion
ID
Signification
Nature Occupation
ID
Signification
Local Type
ID
Signification
Parcel
Parcel_ID
Cadastral section
SIRENE Data
Company_ID
Identification (Adress)
Compan y Id
Name
Road Type
Road Name
Geographical
Localization
Region
Departme nt
Arro ndisseme nt
Canton
Commune
postal Code
Economic characteristic
Activity(700 classes)
Turno ver ( Euros)
Effective employees
Date of creation
Seasonal character
Princip al act ivity
Sec
ndar y Activit y
Non Built Prop
PNB_ID
Cadastra l Section
Parcel cap acity
Parcel
Parcel reference
Road number
Surface Description
PNB_ID
Culture nature
Special cu lture nature
Reference parcel
Constructible terrain
Culture Nature
ID
Signification
Commune
Commune _ID
P1(X, Y)
P2(X, Y)
P3(X, Y)
…
Pn(X, Y)
Cadastral section
Section_ID
P1(X, Y)
P2(X, Y)
P3(X, Y)
…
Pn(X, Y)
Commune_ID
Parcel
Parcel_ ID
P1(X, Y)
P2(X, Y)
P3(X, Y)
…
Pn(X, Y)
Section_ID
Non built Prop
PNB_ID
P1(X, Y)
P2(X, Y)
P3(X, Y)
…
Pn(X, Y)
Parcel _ID
Built Prop
PB_ID
P1(X, Y)
P2(X, Y)
P3(X, Y)
…
Pn(X, Y)
Parcel_ID
IRIS
IRIS_ ID
P1(X , Y)
P2(X , Y)
P3(X , Y)
…
Pn(X , Y)
IRIS Attributes
IRI S_ ID
Attr1
Attr2
..
Attrn
Following the trend of the development of data
warehousing and data mining techniques, we
propose to construct spatial data warehouses to
facilitate online spatial data analysis for natural
hazard management.
Spatial data can be analysed taking into account
different aspects, for example, whether the type of
the predicates and the results is spatial or non-
spatial. Moreover, another classification criterion
can be used taking into account the fact that
topological or non-topological relationships can be
the main focus of analysis. This work will focus on
representing spatial and non-spatial data in a
multidimensional model. Moreover, this work will
show that multidimensional model is more suitable
for doing analysis in hazards management.
2.1 Data Sources
According to their nature, data can fall into three
different categories: non-spatial data, spatial data,
and hazards data.
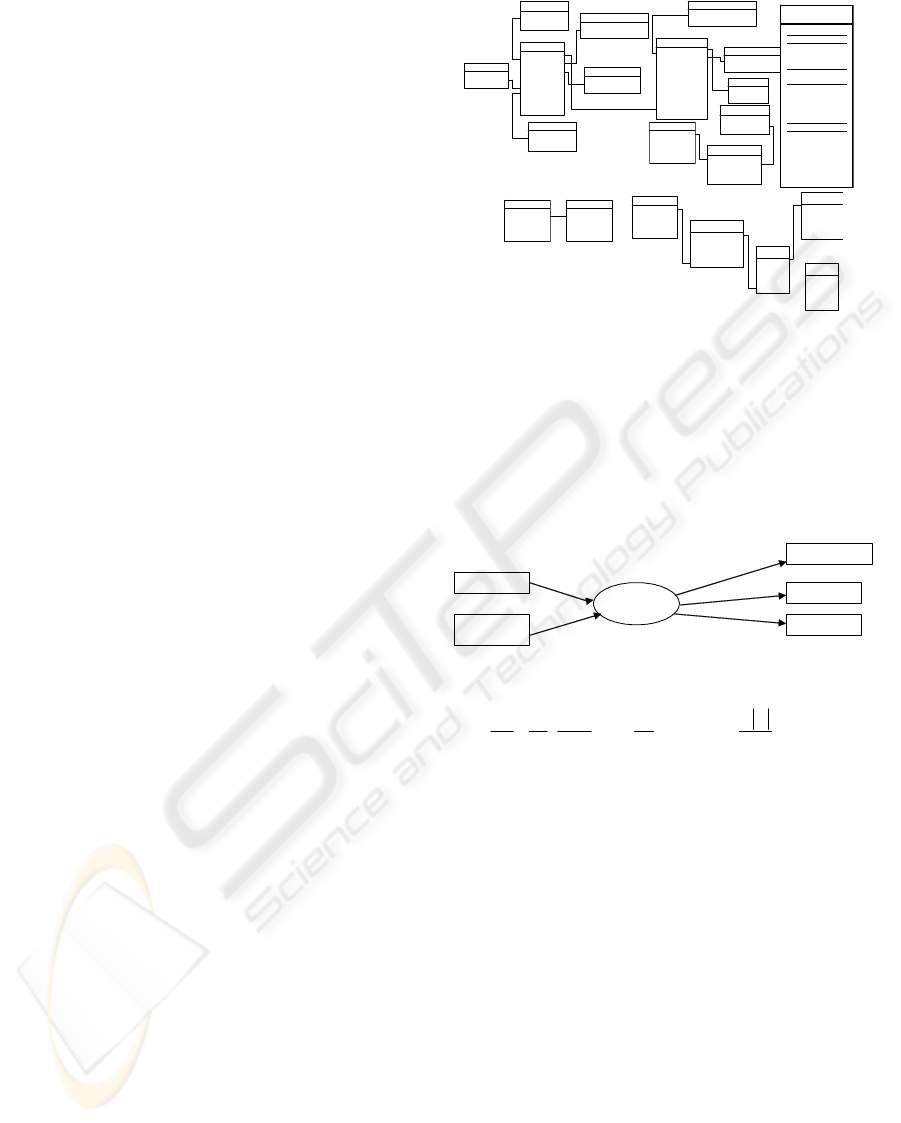
2.1.1 Non-Spatial Data
It’s mainly composed of two different sources (see
figure 1). Data for describing exposed elements such
as population and buildings data: These data are
mainly used for describing the vulnerability of
elements present on the territory. Some of these
information are: building area, date of completion,
building material, presence or not of heating, etc.
The other part of data is those describing companies
activities. In our case this is represented by the
SIRENE Data, that gives geographical and economic
information of companies
.
2.1.2 Spatial Data
Spatial data used in the data warehouse are
principally composed of spatial elements such as
communes, parcels, building (see figure 1). The
other components of spatial data are geological
maps, Ortho-photos,DEM (digital elevation model),
Geological Maps, Ortho-photo
.
Figure 1: Spartial and Non-spatial data involved in the
data warehouse
2.1.3 Hazards Data
The data describing hazards behaviors are stored nowhere,
but must be computed according to a specific hazard with
mathematical models using data sources. For example, in
the case of floods hazard (figure 2), the data needed are
digital elevation model, hydrological and hydraulic model.
DEM
Hydrologic
parameters
Hydrologic
modeling
Water elevation
Intensity
velocity
Figure 2 : Steps for computing floods hazards data
0
2
0
2
=+−
∂
∂
+
⎟
⎟
⎟
⎠
⎞
⎜
⎜
⎜
⎝
⎛
∂
∂
+
∂
∂
K
QQ
gAgAS
x
h
gA
A
Q
xt
Q
β
Equation 1: Flood Estimation by Saint Venant Equations
Each natural hazard can be represented by different
parameters. In the case of floods for example, the
parameters as seen above (figure 2) are water
elevation, intensity, and velocity. These parameters
differ from a hazard to another. The sources
containing those parameters have a field-based
structure, i.e. where space can be seen as continuous
field, and the information of interest (flood
parameters) is obtained at each point of space (see
equation 1 for an example for such an equation). We
can use these parameters individually or compute a
new synthesizing indicator.
ICEIS 2005 - DATABASES AND INFORMATION SYSTEMS INTEGRATION
416

2.2 Data warehouse multidimensional
model
There is a huge number of information related to
hazard analysis that are either stored or computed
from the data sources such as risk indicator, parcel
information: area, date of completion, building
material, presence or not of heating, population
information, company information, etc. A user may
like to view risk patterns on a map by building, by
parcel, by cadastral section, by elevation and by
different combinations of population and company
activities information, or even like to dynamically
drill-down or roll-up along any dimension to explore
desired patterns, such as high or low risky regions.
Spatial data can be analysed by taking into account
different aspects, for example, whether the type of
the predicates and the results is spatial or non-
spatial. Moreover, another classification criterion
can be used by taking into account the fact that
topological or non-topological relationships are or
not the main focus of analysis. In this paper, we use
the terminology usually used in multidimensional
modelling such as dimension type, fact relationship,
hierarchy, level.
2.2.1 Measures
Measures are attributes representing the specific
elements of analysis, such as Locative Value, area.
In general, they can be summed or averaged in order
to understand the particular aspects in consideration.
We distinguish two types of measures in a spatial
data warehouse (Han, 1997):
Numerical measure: a numerical measure is a
measure containing only numerical data. For
example, one measure could be total revenue of a
building, and a roll-up may give the total revenue by
parcel, by cadastral region, and so forth.
A simple example of numerical measure computing
is:
Select Sum(TotalLocativeValue)
From Built Prop
Group By ParcelId.
Numerical measures can be further classified into
distributive, algebraic, and holistic (Kimbal, 1996).
Spatial measure: A spatial measure is a measure
which contains a collection of pointers to spatial
objects. For example, during the generalization
procedure, the parcels with the same range of risk
indicator are grouped into the same cell, and the
measure so formed contains a collection of pointers
to those parcels.
2.2.2 Dimensions
Dimension is an object that includes attributes
allowing the user to explore the measures from
different perspectives of analysis. In the context of
spatial data warehouse, we distinguish three types of
dimensions according to whether or not it has spatial
references.
Non-Spatial dimension: A non-spatial dimension is a
dimension containing only non-spatial data. In our
case, risk indicator can be considered as a non-
spatial dimension. It contains non-spatial data
corresponding to risk value, whose generalization is
also non-spatial, such as low-risky, and high-risky.
Spatial-to-non-spatial dimension: A spatial-to-non-
spatial dimension is a dimension whose primitive
level data is spatial but whose generalization,
starting high level, becomes non-spatial. We will not
handle this type of dimension in our case.
Spatial Dimension: A spatial-to-spatial is a
dimension whose primitive level and all of its high
level generalized data are spatial. For example, in
our case, building, parcel, cadastral section, and
Commune are all spatial elements of the location
spatial dimension.
2.2.3 Star Model
The most known logical model used for the DW
design is called star scheme having his center
represented by a fact table surrounded with several
dimension tables forming star-like appearance. This
model is also called multidimensional model due to
the fact that several dimensions (multiple
dimensions) are used to analyze the measures. Since
the data warehouse is subject-oriented, and in
natural hazard framework, we focus our analysis on
vulnerability aspect; we will build our model with an
emphasis on vulnerability measures that can be
obtained or computed from data sources such as
total revenue, effective employees, and turnover
sales. Hence, the model (see figure 3 and 4) contains
one fact table (with vulnerability measures),
surrounded by (spatial and non spatial) dimensions
tables.
2.3 OLAP operations
With the above specified dimensions, OLAP
operations can be performed by stepping up and
down along any dimension shown in Figure 4, we
will use popular OLAP operations and analyze how
they are performed on a spatial data cube:
Slicing and dicing: each of which selects a portion of
the cube based on the constant(s) in one or a few
dimensions. For example, one may be interested
TOWARDS DATA WAREHOUSES FOR NATURAL HAZARDS
417

only in risky regions located in a particular region or
in regions of risk indicators. This can be realized by
transforming the selection criteria into a query
against the spatial data warehouse and be processed
by query processing methods (Gray, 1997).
Hazard
Natural Hazards Technological Hazards
ALL HAZARDS
floods Fires Land-slide Avalanche Chemical Nuclear
[0,25]
VM VM VM VM VM VM VM
Low Risk
(%)
[25,30]
VM VM VM VM VM VM VM
[31,45]
VM VM VM VM VM VM VM
[46,65]
VM VM VM VM VM VM VM
[66,70]
VM VM VM VM VM VM VM
Medium
Risk
(%)
[71,75]
VM VM VM VM VM VM VM
[76,85]
VM VM VM VM VM VM VM
High Risk
(%)
[86,100]
VM VM VM VM VM VM VM
Pivoting: which presents the measures in different
cross_tabular layouts. This can be implemented in a
similar way as in non-spatial data cubes. For
example, a spreadsheet table containing Risk
Indicator and Hazard category as row and columns
respectively may be presented to a user (see figure
4). The values (e.g cells) in the table may contain the
number of the vulnerable population of the
corresponding region(s)
.
Figure 3: Spreadsheet table presenting results of pivoting
Operations on Data Cube. Where, VM is a vulnerability
measure, such as population number
Roll-up: which generalizes one or a few dimensions
(including the removal of some dimensions when
desired) and performs appropriate aggregations in
the corresponding measure(s). For example, one
may roll-up
on hazard dimension to get summarized information.
For non-spatial measures, aggregation is
implemented in the same way as in non-spatial data
cubes (Stefanovic, 2000). It is challenging to
efficiently implement such operations since it is both
time and space consuming to compute spatial merge
or overlay and save the merged or overlaid spatial
objects. For further discussions, we refer reader to
(Bédard, 2001).
Drill-down: which specializes one or a few
dimensions and presents low-level objects,
collections, or aggregations. This can be viewed as a
reverse operation of roll-up and can often be
implemented by saving a low level cuboid and
performing appropriate generalization from it when
necessary.
The figure 4 gives an overview of possible OLAP
operations. By Providing online operations, flexible
summarizing and tabulating, the data cube can be an
essential part of the decision support process in
natural hazard management. The multidimensional
views offered by the data warehouse allow decision
makers to have multiple insights on their data
.
[75, 100]
Parcel 1
Parcel N
[0, 25]
Flood Landslide
Parcel 1
Parcel N
0, 25 75, 100
Pivot
0 , 25
75 , 100
Parcel 1 Parcel N
[26, 50]
[0, 25]
Landslide Flood
Location
Risk
Indicator
Natural
Hazard
Vulnerability
Measure
Roll-up on location
(from Building to
Cadastral
p
arcels
)
Dice for
(location = ‘Parcel A’ or ‘Parcel B’)
and
(hazard = ‘flood’ or ‘landslide’) and
(
risk indicator = ‘0-25’ or ’26-50’
Slice
For Hazard = ‘Flood’
Drill-down
on location
(From Cadastral sections to Parcels)
[75, 100]
Section 1
Section N
[0, 25]
Flood Landslide
Parcel A
Parcel B
Vulnerability Measure
Figure 4: Overview of Olap operations on data cube 4
3 CONCLUSION
In this paper, we have studied the construction of a
spatial data warehouse in the framework of natural
hazard management. The data warehouse is based on
a data cube model which consists of both spatial and
non-spatial
dimensions and measures, the cube model handles
spatial information in addition to non-spatial
information. Then, we have surveyed the main
OLAP operations to facilitate the browsing and
exploration tasks on data cube.
Natural hazards are time-occurring phenomena.
Therefore temporal dimension need to be handled in
such a framework. In addition, spatial as well as
non-spatial data can change their values over time.
Particularly, in the DWs where the data is stored for
long periods of time and where the changes to these
data cannot overwrite the already existing values,
the important consideration is how to represent the
time during which these values are valid. DWs
consider the temporal aspect in a very limited way
ICEIS 2005 - DATABASES AND INFORMATION SYSTEMS INTEGRATION
418

by including the time dimension and offering to
represent the changes in time referring them only to
the measures.
REFERENCES
Theodoratos, D., and Sellis, T. 1999. Design data
warehouse In Data and Knowledge Engineering, Vol.
31, pp. 279-301.
Adriaans P. and D. Zantinge. 1996. Data Mining, Addison
Wesley Longman Limited, Reading, Massachusetts.
J. Widom, 1995. Research problems in data warehousing,
In Proc the Int. Conf. on Information and Knowledge
Management pages 25- 26 Baltimore, Maryland.
J. Han, K. Koperski and N. Stefanovi, 1997. GeoMiner: A
system prototype for spatial data mining. In Proc.
1997 ACM SIGMOD Int Conf Management of Data
pages 553 – 556 Tucson Arizona.
Han J., Stefanovic N., and Koperski K., 1998. Selective
Materialization: An Efficient Method for Spatial Data
Cube Construction. In Pacific-Asia Conf. on
Knowledge Discovery and Data mining, PAKDD.
Stefanovic N., Han J., and Koperski K., 2000. Object-
Based Selective Materialization for Efficient
Implementation of Spatial Data Cubes. In IEEE
Transactions on Knowledge and Data Engineering
(TKDE), 12(6).
Bédard Y., Merrett T., Han J., 2001, Fundaments of
Spatial Data Warehousing for Geographic Knowledge
Discovery. In Miller H. and Han J. (eds.) Geographic
Data Mining and knowledge discovery. Taylor &
Francis.
Shekhar S., Lu C.T., Tan S., Chawla S. and Vatsavai R.R.,
2001, Map cube: a visualization tool for spatial data
warehouses. In Miller H., Han J. (eds.) Geographic
Data Mining and Knowledge Discovery. Taylor &
Francis.
Kimbal R, 1996, The Data Warehouse Toolkit. John Wiley
& Sons.
J. Gray. S. Chaudhuri, A Bosworth, 1997, Data cube: A
relational aggregation operator generalizing groupby
crosstab and subtotals Data Mining and Knowledge
Discovery, 29-54.
TOWARDS DATA WAREHOUSES FOR NATURAL HAZARDS
419
