
SCENARIO-BASED EVALUATION OF ENTERPRISE
ARCHITECTURE
A top-down approach for chief information officer decision making
Mårten Simonsson, Åsa Lindström, Pontus Johnson, Lars Nordström, John Grundbäck,
Olof Wijnbladh
Department of Industrial Information and Control Systems,
Royal Institute of Technology, KTH, Stockholm, Sweden
Keywords: Decision Making Support, Enterprise Architecture, Chief Information Officer.
Abstract: As the primary stakeholder for the Enterprise Architecture, the Chief Information Officer (CIO) is
responsible for the evolution of the enterprise IT system. An important part of the CIO role is therefore to
make decisions about strategic and complex IT matters. This paper presents a cost effective and scenario-
based approach for providing the CIO with an accurate basis for decision making. Scenarios are analyzed
and compared against each other by using a number of problem-specific easily measured system properties
identified in literature. In order to test the usefulness of the approach, a case study has been carried out. A
CIO needed guidance on how to assign functionality and data within four overlapping systems. The results
are quantifiable and can be presented graphically, thus providing a cost-efficient and easily understood basis
for decision making. The study shows that the scenario-based approach can make complex Enterprise
Architecture decisions
understandable for CIOs and other business-orientated stakeholders
1 INTRODUCTION
Historically, business operations of large companies
were supported by a number of isolated software
systems performing diverse specific tasks, from real-
time process control to administrative functions.
Today, many companies possess a truly complex
enterprise IT system; in large organizations
thousands of interconnected systems may be
employed.
Typically, the emerging enterprise IT system has
not
evolved through a careful and holistically
planned approach, rather each business unit has
developed and acquired the IT systems they need.
The system support provided may very well be
optimal to the individual business units, but for the
enterprise as a whole it can results in higher costs
and lower quality. A poorly planned (or non-
existent) overall architecture is the harbinger of hard
times to come; problems with inconsistencies will
become inevitable as the IT systems become
increasingly wild-grown (Bracket, 1994),
(Linthicum 2000), (Mc Govern 2003), (Ruh 2001),
Zachman, 1987).
One example of this is overlap, m
eaning that
similar functionality can be found within different
systems and that multiple versions of the same data
are stored within the enterprise IT system. An
increased functionality and data overlap leads to
higher costs for operation and maintenance, because
of the larger number of systems and databases
(Land, 2003). For data overlap, the master/slave
dilemma is one central aspect. It can be hard to find
original (master) data among the multiple versions
(masters or slaves) stored in numerous places deep
inside the system jungle. Inconsistent naming of data
is another common issue; the same piece of data
may have many different names within the
enterprise IT system, and different data sometimes
are given the same name (Bracket, 1994) (Mc
Govern 2003), (Ruh 2001), (CIO Council, 1999).
To complicate the situation further, general
k
nowledge of the systems within the enterprise is
often quite poor. The IT systems are known on a
superficial level, but there is a lack of overview
regarding how the systems are interconnected, which
protocols are employed, how the functionality is
allocated, etc. In-depth information does exist on
individual systems, but the knowledge is scattered
among individuals.
130
Simonsson M., Lindström Å., Johnson P., Nordström L., Grundbäck J. and Wijnbladh O. (2005).
SCENARIO-BASED EVALUATION OF ENTERPRISE ARCHITECTURE - A top-down approach for chief information officer decision making.
In Proceedings of the Seventh International Conference on Enterprise Information Systems, pages 130-137
DOI: 10.5220/0002517301300137
Copyright
c
SciTePress

1.1 Decision Making for the Chief
Information Officer
As responsible for the enterprise IT system, the role
of the Chief Information Officer (CIO) covers a
broad technical and organizational scope, including
areas such as IT-business alignment (Brown, 1993)
(Cassidy, 1998) (Gottschalk, 1999), IT investment
decisions (The Open Group, 2004), IT system
quality assessment and improvement (Kirkpatrick
2002). All these issues may result in architectural
changes (Brown, 1993) (Cassidy, 1998) (Gottshalk,
1999) (Spewak, 1992).
There are plenty of questions that the CIO needs
to answer in order to make decisions. These include,
for instance, what IT system supports a particular
business process, what are the possibilities for
system consolidation, what is the current security
level, how will a new system affect the system
complexity, etc.
The difficulties in finding relevant information
described in the previous section makes decision-
making a complicated task. Since the CIO constantly
lacks time, it is necessary that decisions can be made
quickly and to a small cost. Ad hoc decisions
without direct linking to a uniform IT strategy
should, however, be avoided. Rather, all decisions
should be based on a consistent IT strategy to ensure
a cost-efficient enterprise IT system (Brown, 1993)
(Cassidy, 1998) (Gottshalk, 1999).
Finding adequate information for decision-
making is however often quite problematic, since the
CIO rarely has all the information needed at hand.
The information is spread throughout different
sources within the enterprise. In order for the CIO to
make correct decisions, support is needed to
identify, gather and evaluate this scattered
information. Enterprise Architecture Frameworks,
specifically developed to serve as a controlling
blueprint for the enterprise IT system, has been
proposed as such support (CIO Council, 2001)
(Clinger-Cohen Act, 1996).
1.2 Enterprise Architecture
Frameworks
In order to understand and manage the chaotic real
world of enterprise IT systems, as well as support
the identification, gathering and evaluation of the
scattered information needed for decision making,
the discipline of Enterprise Architecture has
emerged. It has emerged from the need for taking a
holistic approach to IT-system management. This
means that the discipline focuses on not only the
technical aspects but also on the organizational
context in which the IT systems operate. Enterprise
Architecting is thus both a technical and an
organizational undertaking (CIO Council, 1999)
(DoD, 2003) (The open Group, 2003) (Spewak,
1992) (Zachman, 1987).
Enterprise Architecture is a model-based
management and planning approach for the
evolution of enterprise IT systems; it has been
proposed mainly as a response to the ever-increasing
significance and complexity of business-supporting
information systems (CIO Council, 1999) (DoD,
2003) (The open Group, 2003) (Spewak, 1992)
(Zachman, 1987).
The methods and models of Enterprise
Architecture are often presented in frameworks.
Today there exist ten or so well-known architectural
frameworks for management of enterprise IT
systems (CIO Council, 1999) (DoD, 2003) (The
open Group, 2003) (Spewak, 1992) (Zachman,
1987).
However, current Enterprise Architecture
Frameworks, propose that a plethora of models
should be developed and maintained. However, it is
rarely evident when and why a particular model is to
be preferred over others and what questions they are
created to answer. By trying to cover all aspects of
Enterprise Architecture, contemporary frameworks
get too extensive and are therefore difficult to
penetrate in search for relevant information. When it
comes down to hands-on support for decision
making, the current frameworks fall short and
information gathering becomes a time-consuming
and costly issue. This is unfortunate since a model
should be able to answer specific questions.
2 A SCENARIO-BASED APPROACH
FOR DECISION MAKING
As discussed previously, the existing Enterprise
Architecture Frameworks have a different focus and
fall short in providing decision-support to the CIO
(Lindström 2005). In order to be cost effective, the
approach must be goal oriented, i.e. start with what
is to be decided upon, and gather relevant
information to support the decision making. By
questioning the CIO about the information needed to
make a specific decision, a structured gathering of
relevant architectural information can be made. The
CIO should continuously work towards adhering to
the overall IT strategy; therefore the CIO decision
making can be viewed as a problem of selecting the
solution that has the highest degree of fulfilment
towards the IT strategy.
The scenario-based approach for CIO decision
making outlined here (and used in the case study
SCENARIO-BASED EVALUATION OF ENTERPRISE - A top-down approach for chief information officer decision
making
131

described in Chapter 3) was originally described by
Johnson, and consists of three steps described in
sections 2.1 to 2.3 (Johnson, 2004). The power of
the approach lies in its use of hypothetical (what-if)
situations, i.e. scenarios, which implies that the CIO
can play with different ideas without suffering the
cost of actually implementing all solutions. By using
scenarios, the decision-maker and other stakeholders
can discuss possible solutions, their strengths and
weaknesses, in a way understandable for all
stakeholders. On a conceptual level, the approach
mimics the scenario-based Architecture Tradeoff
Analysis Method (ATAM), described by Kazman in
(Kazman, 1998). The approach used here differs
from the ATAM by considering the Enterprise
Architecture as the object of study and by using a
prioritization technique for trade off analysis. In
comparison, the ATAM approach focuses on the
architecture of one single IT system.
2.1 Formulation of scenarios
Firstly, the CIO needs to consider what possible
solutions are available with respect to the future
structure of the enterprise IT system and the problem
at hand. The scenarios must be well delimitated and
easy to separate in order to be understandable and
analyzable for all stakeholders. These hypothetical
solutions, scenarios, are formulated in images and
text to give an easily understood overview of
possible solutions to present problems. In ATAM,
the word architectural option is used in line with the
ATAM approach, where scenarios are elicited from
stakeholders of the system (Kazman, 1998),
scenarios for the Enterprise Architecture are elicited
from stakeholders of the entire Enterprise
Architecture. The scenarios serve both for describing
possible future states of the architecture, as well as
facilitating communication among stakeholders and
analysts of the architecture.
2.2 Identification of evaluation
criteria and indicators
The next step is to identify relevant criteria and
measurable indicators for evaluation of the
scenarios. A good evaluation criterion provides
answers to the questions of the CIO; the more
important questions it answers, the better it is. In
order to be more concrete indicators must be
employed. Indicators are measurable properties such
as number of systems or a yes or no answer. As the
real world is complex, multiple evaluation criteria
and indicators can be found for each decision. The
relation between the criteria and the indicator is
called architectural theory and can be simple rules of
thumb or more strict and precise presumptions.
Using IT-security as an example, one
architectural theory is that a system with a firewall
has higher security than one without. In this case,
high IT-security is the criteria, and an indicator
might be simply counting the number of systems not
protected by a firewall.
Again conceptually similar to the ATAM
approach, where system requirements are used as
criteria, the approach proposed here relies on criteria
or architectural theory to evaluate the architecture.
Though, the scenario-based approach differs in the
scope of the criteria. In ATAM, the requirements are
relatively detailed, while the criteria proposed here
are more in line with the indicators used in e.g.
Balanced Score Card approaches (Kaplan, 1996),
used to evaluate business strategies and measure
business performance.
2.3 Analysis and selection of scenarios
Analysis is the application of evaluation criteria and
indicators on scenarios for evaluation purposes.
Usually only a subset of the available criteria and
indicators are analyzed, since using all of them is a
time consuming task for the CIO.
The selection of indicators is based on how much
effort must be spent on finding the needed
information, the usefulness of the indicator, the
relevance for the CIO and the credibility of the
theory issuing party (Johnson, 2004).
Furthermore, because of company policies and
goals, some criteria are more important than others.
Therefore, the CIO is given the opportunity to
prioritize among the criteria, which results in
weighted criteria. Another reason for the
prioritization is to manage trade offs between
contradicting criteria. The prioritization of
evaluation criteria and choice of indicators are two
of the major advantages with the scenario-based
approach.
For the prioritization, a web-based tool for
prioritizing requirements is proposed since it is easy
to use. The prioritization technique is built on AHP
(Karlsson, 1998). The prioritization tool picks two
criteria and lets the respondent perform a pair-wise
comparison. Each criterion is compared multiple
times. A nine-grade scale is used for the
prioritization, and results in a prioritization ladder
with the respective weight of each criterion
represented as a fraction of 100 %.
Different views, showing only a subset of the
indicators, are employed in order to simplify the
analysis. A system-activity view, for example,
ICEIS 2005 - DATABASES AND INFORMATION SYSTEMS INTEGRATION
132
illustrates the alignment between IT systems and
business process activities.
The indicators are applied on and measured for
each scenario. In order to be able to compare the
different indicators, the measures are normalized.
Each scenario is presented to the CIO along with
the measurements performed at it, thus serving as
basis for a discussion on the results of the
architectural analysis. Finally, the CIO may select
one of the scenarios to be implemented.
3 APPLICABILITY TESTING: CASE
STUDY
A case study was carried out to test the general
applicability of the scenario-based approach
described in the section above. Empirical data was
collected from one of the largest electric utilities in
Europe, with an annual turnover of $14.5 billion
(2003). According to CIOs at the utility, 350 major
software systems are employed in order to run core
processes and administrative functions.
An increased integration of formerly stand-alone
systems over the past decade and acquisition of new
systems has resulted in a likewise augmented
occurrence of overlap in terms of functionality and
data. The main focus of the case study is thus a
matter of defining how functionality and data should
be allocated between existing systems. There are, of
course, numerous solutions to this problem, which
entails the necessity of a proper analysis basis for
choosing the most adequate solution.
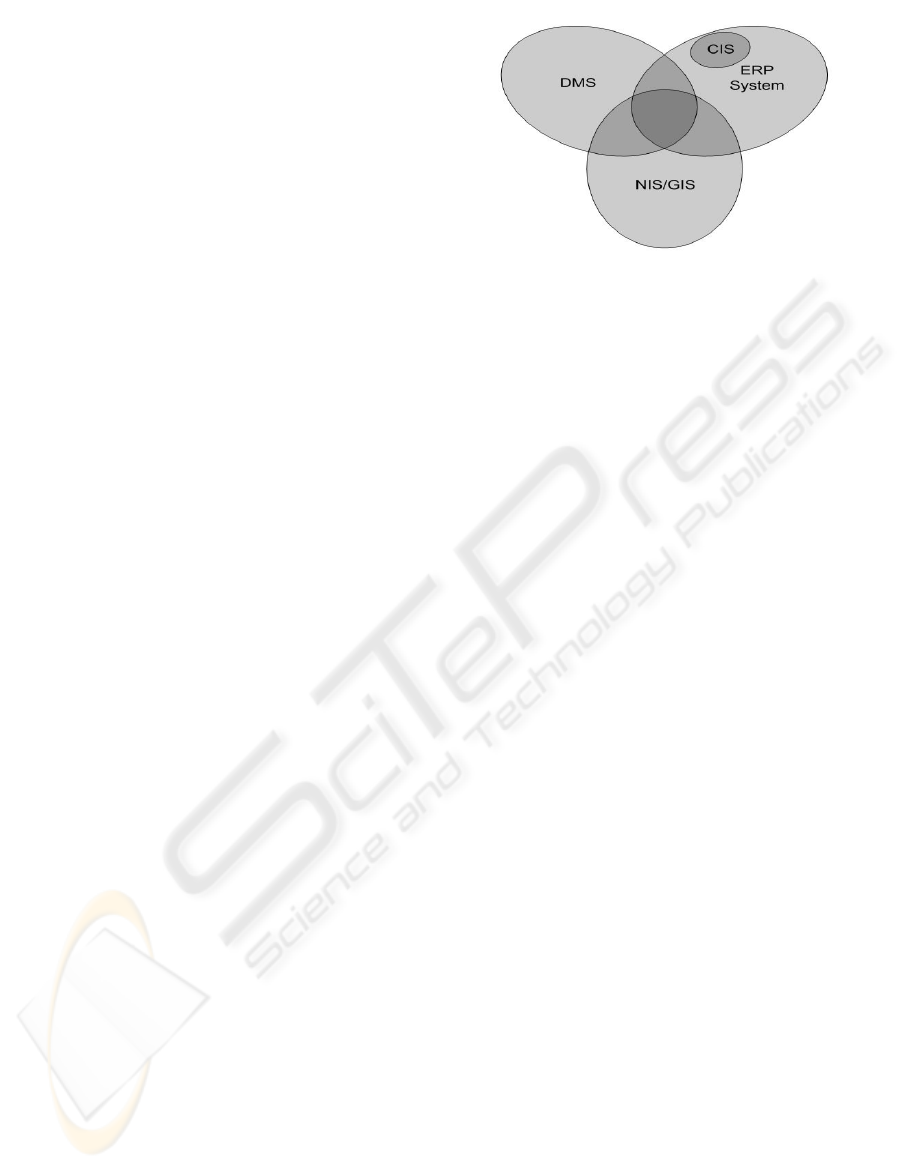
This case comprises
four main systems in the service process, which
manages repairs and extensions of the power
distribution grid. The systems are the Enterprise
Resource Planning system (ERP), the Distribution
Management System (DMS), the combined Network
Information System and Geographical Information
system (NIS/GIS) and the Customer Information
System (CIS). All these systems, except for the CIS,
provide some amount of unique functionality, but
also overlap in that some functionality is shared
between two or more systems. See Figure 1.
The case study was conducted as collaborative
work between the individuals within the CIO
function at the utility and the authors.
Figure 1: The overlap dilemma
3.1 Formulation of scenarios
The systems involved in the current service process
were studied to obtain an understanding of the
situation. A total of 37 activities were identified
within the process. About 35% of these were
affected by an overlap. It was found that the main
overlap exists between the ERP System and the
DMS. These two can, independently, control the
workflow of the process apart from a few specific
activities. The ERP System and the DMS are,
however, not completely replaceable. No matter
which one is chosen to supervise the process; the
other system is still needed to perform certain tasks.
Furthermore, an overlap in managing customer
related data and asset data were identified. The first
can be located in either one of the CIS or ERP
systems whilst the latter can be stored in the
NIS/GIS or in the ERP system. To summarize, the
overlap dilemma for the service process at the
electric utility comprises an overlap in the process
workflow and an overlap in managing customer and
asset data.
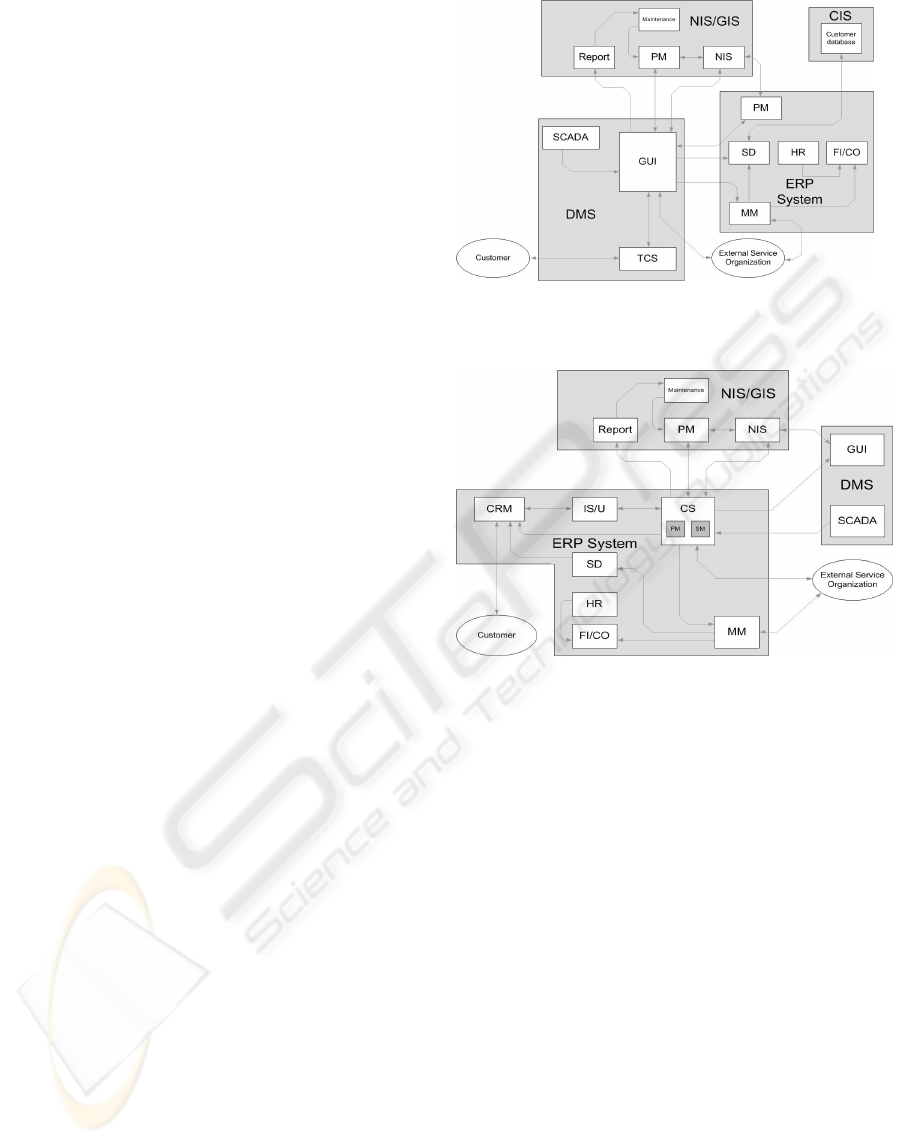
Six scenarios for the automation of the service
process were found. Simplified illustrations for the
system-data view for two of the scenarios are
presented in this paper; see Figure 2 and Figure 3.
The main difference between these two scenarios is
that the system in control of the workflow (as in
managing the flow of information between different
entities) varies. Figure 2 shows a scenario where the
DMS is in control of the workflow. All four main
systems, the CIS included, are employed to run the
process. In the ERP System scenario depicted in
Figure 3, the ERP System manages the workflow.
Just three software systems are employed for
running the process. The CIS is removed and all
customer related data is incorporated into the CS
module of the ERP system.
Please observe that the total amount of modules is
not constant between the two scenarios. This is due
SCENARIO-BASED EVALUATION OF ENTERPRISE - A top-down approach for chief information officer decision
making
133

to the fact that when the ERP System takes control
over the workflow, some modules become obsolete,
and vice versa.
3.2 Identification of evaluation
criteria and indicators
As stated, the approach outlined here is conceptually
similar to other scenario-based architectural
evaluation methods, e.g. ATAM (Kazman, 1998).
However, when evaluating entire Enterprise
Architectures, quality attributes used in such
methods, fall short in providing a sound basis for
evaluation. Other criteria and architectural theory
must be found as well, due to the broader scope.
Finding the architectural theory is the work of
researchers since the credibility of the theory issuing
part should be high.
As is the case for measures used in e.g. the
Balanced Score Card, the indicators used in the
scenario-based approach must be aligned with the
strategic goals of the enterprise (Kaplan, 1996). The
CIO can therefore evaluate the scenarios based on
their fulfilment of the corporate IT strategy. For the
case study on allocation of functionality and data
across a number of IT systems, the indicators need
only to reflect a subset of the entire corporate IT
strategy.
The set of indicators used in the case study
emanates from strategy fulfilment measures used by
the CIOs at the studied utility and a compilation of
indicators to judge function allocation taken from
literature. The opinions of the CIOs, as
knowledgeable stakeholders for the applied
Enterprise Architecture, were stressed. When
appropriate architectural theory was not found in
literature, rules of thumb and common sense had to
be applied to define measurable indicators.
For example, a suitable indicator for the
Modifiability criterion is to measure the number of
modules in a particular solution (Oskarsson, 1981).
Again, for Complexity, a suitable measure is the
number of systems and modules involved
(Linthicum, 2000). Interestingly, as can be seen
from the above, the indicators may require a tradeoff
analysis since some may be contradictory. This latter
point stresses the fact, that although evaluation
criteria can be measured, the optimal solution to the
problem will require more analysis than merely
adding up the measures.
A set of nine criteria was used. Below is a short
description of the criteria (bold) and indicators
(italic) used in the case study. Please note that the
same indicator might be used for measuring several
criteria, as mentioned earlier in this section.
Architectural changes – The number of changes
that are made to the original architecture. The
number of databases relocated and the number of
systems added or removed were used as indicators
for measuring this criterion.
Accessibility of data – The ease with which the
user can access the data. For the ease of access, data
should be located as close to where it is needed as
possible (CIO Council, 1999). The indicator used for
measuring this was the number of data transfers
between systems needed on a per function basis.
IT-Business alignment – How well the IT
systems support the business processes (Cassidy,
1998) (CIO Council, 1999) (Luftman, 2000). Here, a
rule of thumb is provided by (Luftman, 2000), who
states that the more use of an ERP system, the better
the alignment. The architectural guidelines of the
electric utility equally advocate that functionality
should preferably be implemented in the ERP
system. The indicator used for measuring this was
the number of functions controlled by the ERP
system.
Efficiency – The CIO function defined efficiency
as a low total dataflow between the systems. The
indicator that was used in order to measure
efficiency was the number of data transfers between
systems.
Modifiability – The ease with which a system
can be changed (internally). A system is considered
modifiable if existing modules easily can be
replaced and new ones can be added (Bass, 1998)
(Kazman, 1998) (Oskarsson, 1981). Two indicators
were used to measure the modifiability: The number
of modules per system and the number of standards
that each software system supports.
Quality of data – Quality of data is a broad term.
To ensure that the data meets the businesses needs, it
shall be accurate, complete, consistent, timely and
flexible (Bracket, 1994) (Linthicum, 2000). The CIO
function focused on the number of data transfers
needed to carry out the process as an indicator for
measuring quality of data.
Accuracy of data – All handling of data can
result in decreased accuracy, since data might
become corrupt during the conversions related to the
handling (Boehm, 1978). Two different indicators
were used to measure accuracy: The number of times
that databases have to be updated in order to run
the process and the number of data transfers
between systems needed on a per function basis.
Scalability – The ability to grow/shrink the
capacity/performance of a system according to the
demand of the environment in which it operates. A
scalable system should therefore be highly
structured and comprise many fully separable
modules (Kazman, 1998) (Linthicum, 2000) (The
Open Group, 2003). The indicator used for
ICEIS 2005 - DATABASES AND INFORMATION SYSTEMS INTEGRATION
134
measuring scalability was the average number of
modules per system.
System complexity – A complex architecture is
difficult to understand, verify and change. System
complexity both refers to the software architecture
and the environment in which it operates
(Linthicum, 2000) (Zachman, 1987). Two indicators
were used for measuring system complexity, the
number of systems involved in the process and the
number of suppliers involved in realisation and
support of the scenario.
3.3 Analysis of scenarios
Each scenario was illustrated with a set of views,
showing certain relationships between entities. As an
example of how the views were employed in the
case study, simplified versions of the system-data
views for two of the scenarios are presented in
Figure 2 and Figure 3. The views show relationships
and data transfers between the systems and their
modules respectively. Grey boxes represent the
systems and white boxes symbolize lower-level
system modules, i.e. Human Resources System,
Graphical User Interface, and so on. The arrows
illustrate data transfers, flow directions are indicated
by the arrow heads.
Apart from the system-data view, a process-
system view, showing relationships between process
activities and systems, and a process-data view
depicting relationships between activities and data
flows, were applied for each of the six scenarios.
These views are not necessary for showing the
applicability of the approach and are therefore not
presented in this paper.
An unweighted score, representing for example
the number of modules or data connections in a
certain view, the grade of fulfilment to a security
policy, etc., was then obtained for each indicator,
and the same score was used for the corresponding
criterion. For instance, the number of systems
employed in each scenario served as an indicator for
measuring the system complexity criteria. As can be
seen in the simplified Figure 2 and Figure 3, the
ERP System scenario employs fewer systems than
the DMS scenario and was therefore considered
having less system complexity. Please note that the
figures presented in this paper are extremely
simplified and cannot be used for repeating the
measurements with accurate results.
Figure 2: DMS scenario, DMS manages the workflow
Figure 3: ERP System scenario, ERP System manages the
workflow
In order to normalize the scores, the best
scenario for each criterion was allotted 10 points.
The other five were normalized against it, resulting
in unweighted scores between 1 and 10 for each
indicator and scenario. When multiple indicators
were used for measuring a single criterion, average
scores was calculated.
Prioritization of criteria was conducted with
key personnel at the utility, aiming for an
identification of the most important criteria, seen
from the utility’s point of view. The evaluation was
tailored so that it would bring out the system
qualities regarded as most vital. The participants
were asked to weigh criteria in a pair-wise
comparison. A prioritization ladder was then
obtained with the respective weight of each criterion
represented as a fraction of 100%.
A weighted score could be calculated by
multiplying the score of a criterion by its respective
weight. The total weighted score is the sum of the
weighted score for all criteria in one scenario. It
comprises the final result of the study.
SCENARIO-BASED EVALUATION OF ENTERPRISE - A top-down approach for chief information officer decision
making
135
3.4 Results
When studying the total unweighted scores only, it
showed that the results varied with less than 15
percent between the six scenarios.
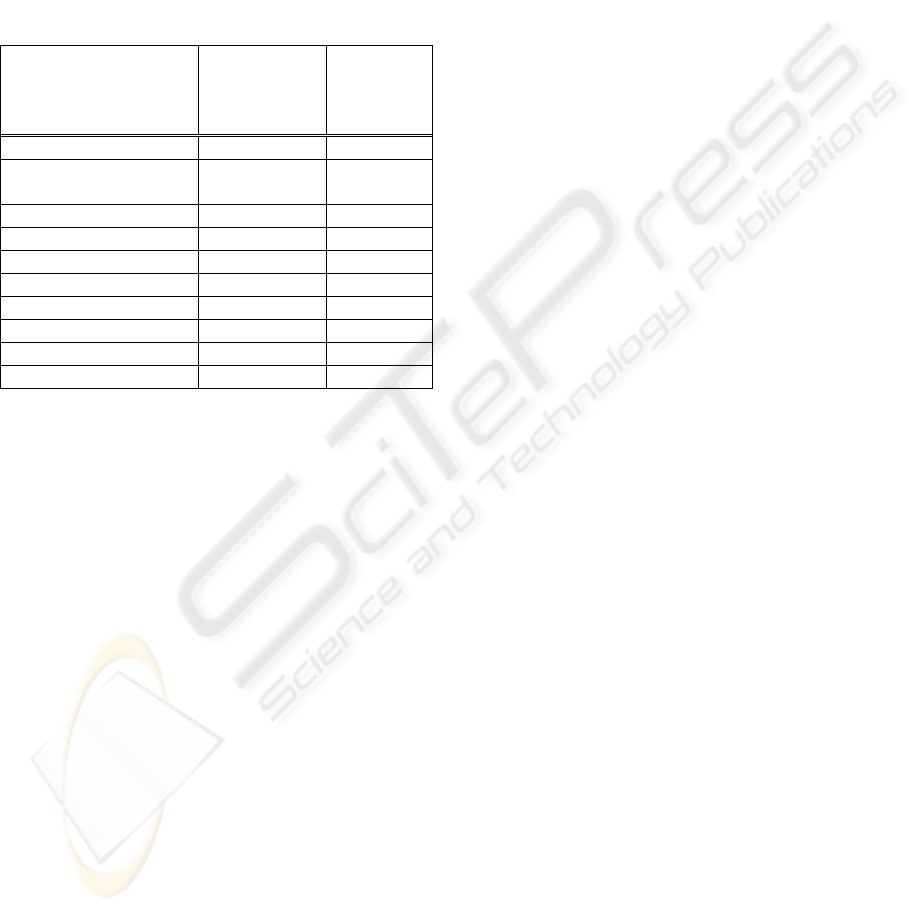
Table 1 shows the results for two of the scenarios.
However, when looking at the unweighted scores for
specific criteria, it showed that they varied heavily
between scenarios.
Table 1: Prioritized criteria with unweighted and weighted
scores for two scenarios
Criterion (Priority) ERP System
score
(unweighted/
weighted)
DMS
score
(unweighted/
weighted)
Quality of Data (21%) 10 (210) 7 (147)
IT-Business Alignment
(18%)
7,5 (135) 4 (72)
Accuracy of Data (15%) 10 (150) 8 (120)
Accessibility (11%) 10 (110) 8 (88)
Efficiency (9%) 10 (90) 8 (72)
Scalability (8%) 8 (64) 9 (72)
System complexity (8%) 9 (72) 8 (64)
Modifiability (7%) 8 (56) 8,5 (60)
Architectural changes (4%) 8.5 (34) 10 (40)
Total score: 81 (921) 70,5 (735)
All scenarios were individual and had distinctive
strengths and weaknesses. It could also be concluded
that each scenario did better on at least one criterion
than any other. For example, the DMS scenario
depicted in Figure 2 was generally better at
modifiability and scalability (even though the
differences were small), while the ERP System
scenario depicted in Figure 3 did better on Quality of
Data and IT-Business alignment. No scenario was
without merit and therefore no clear winner could be
identified by using the total unweighted scores only.
The CIO inevitably should consider trading one
quality for another in order to make a decision on
which scenario is the better of the six.
The differences between the scenarios increased
when the prioritization of the criteria was taken into
account. As can be seen in Table 1, some criteria
were deemed twice as important as others. Given the
fact that Quality of Data, IT-Business alignment,
Accuracy of Data, and Accessibility were considered
the most important criteria, it was clear that the ERP
System scenario by far exceeded the DMS scenario.
The suggestion given to the utility was therefore to
implement the former solution.
4 DISCUSSION AND CONCLUSIONS
To minimize the frequency of architectural ad-hoc
decisions made by CIOs, tools are needed. Since
many CIOs today serve as human fire extinguishers
instead of having the strategic and proactive role
they should, these tools must be sharp, easy to use
and time saving. The contribution of this study is a
well-defined approach to identify and evaluate
possible solutions to any given Enterprise
Architecture-related problem.
Today, the available tools include different
Enterprise Architecture Frameworks, which are hard
to apply in the real world because of their
extensiveness. If the proposed top-down approach is
used, the question that the CIO needs answers to do,
together with a set of criteria, provide guidance for
collecting adequate information. Merely a minimum
of views, containing relevant information, are
created and used for analysis purposes. The
approach stresses that criteria should be prioritized
and that only the most relevant criteria and
indicators should be used. The aim is to have just
enough information to make the right decision. This
serves four purposes:
1. Less time is spent on searching for
information that is not needed.
2. The general soundness of the architectural
theory for the particular question, according
to the CIO, is taken into account.
3. Tradeoffs between criteria are identified
and evaluated.
4. The relative importance of each criterion
will influence on which scenario that will
be selected.
The case study showed that all scenarios were
individual and had distinctive strengths and
weaknesses. It could also be concluded that each
scenario did better on at least one criterion than any
other. It was thus a matter of trading off benefits and
disadvantages arbitrary between the scenarios. Thus,
the differences between the scenarios increased
when the prioritization of the criteria was taken into
account. Without a structured tradeoff between
properties, a scenario that scores high on a property
with low priority may receive he highest total score.
After a consultation with CIOs at the utility, the
scenario that best fitted the requirements was
selected. In order to carry out a scenario-based
evaluation of Enterprise Architecture with a reliable
result, evaluation criteria must be taken from widely
accepted sources. It is therefore a task for academia
to provide the industry with general architectural
theory.
The evaluation criteria used in the case study can
be refined by digging deeper into literature. Relying
ICEIS 2005 - DATABASES AND INFORMATION SYSTEMS INTEGRATION
136

on a solid base of theory from multiple and well-
known sources, the evaluation criteria can be trusted.
The case study also showed that finding indicators
for measuring criteria can be quite hard. Rules of
thumb and common sense had to be applied in
certain cases.
The results, being quantifiable and illustrated,
provide a search cost-efficient (using only relevant
criteria for evaluation), high-quality (based on
multiple and well known sources) and easily
understood (explained at a high level of abstraction)
basis for decision making. This was confirmed by
interviewing several CIOs at the electric utility a few
months after the original study was committed. They
all agreed on the usefulness of the scenario-based
approach, and the different scenarios served as a
basis when deciding upon the future of their IT
systems. According to the CIOs, an analysis could
be made rapidly and in a structured manner. The
views served well in explaining complex cross-
dependencies between systems. The study shows
that this scenario-based approach can make complex
Enterprise Architecture decisions
understandable for
both CIOs and stakeholders with poor IT
knowledge.
ACKNOWLEDGEMENTS
The authors would like to thank Georg Karlén, Chief
Information Security Officer (CISO) at Vattenfall
AB for providing valuable input to the case study.
REFERENCES
Bass, L., Clements P., Kazman R., 1998, Software
Architecture in Practice, Reading, Massachusetts,
Addison-Wesley.
Boehm, B. W., et al, 1978, Characteristics of software
quality, North Holland.
Brown, C., 1993, “The Successful CIO: Integrating
Organizational and Individual Perspectives”,
Proceedings of SIGCPR ´93.
Brackett, M., 1994, Data Sharing: Using a Common Data
Architecture, John Wiley & Sons Inc.
Cassidy, A., 1998, Information Systems Strategic
Planning, Boca Raton, Florida, St Licie Press.
Chief Information Officer Council, 1999, The Federal
Enterprise Architecture Framework, CIO Council.
Chief Information Officer Council, 2001, The Federal
Enterprise Architecture, CIO Council.
Clinger-Cohen Act of 1996 (formerly known as the
Information Management Reform Act), 1996, Division
E National Defense Authorization Act for FY,
February 10.
Department of Defense, 2003, The Department of Defense
Architecture Framework, Department of Defense.
Gottschalk, P., 1999, “Strategic Management of IS/IT
Functions: The Role of the CIO in Norwegian
Organizations”, International Journal of Information
Management, Vol 19, pp. 389-399.
Johnson, P., Ekstedt, M., Silva, E., Plazaola, L., 2004,
Using Enterprise Architecture for CIO Decision-
Making: On the importance of theory, In the
Proceedings of the 2nd Annual Conference on Systems
Engineering Research (CSER).
Kaplan R., Norton D., 1996, The Balanced Scorecard,
Boston, Massachusetts, HBS Press.
Karlsson, J., Wohlin, C., Regnell, B., 1998, On Evaluation
of Methods for Prioritizing Software Requirements,
Information and Software Technology, 39(14-15):939-
947.
Kazman, R., Klein, M., Barbacci, M., Longstaff, T.,
Lipson, H., Carriere, J., 1998, The Architecture
Tradeoff Analysis Method, Proceedings of the Fourth
IEEE International Conference on Engineering of
Complex Computer Systems (ICECCS), Monterey,
CA.
Kirkpatrick, K.A., 2002, “CIO Role Survey (350
American senior IT executives)”, CIO Insight
Magazine.
Land, R., Crnkovic, I., 2003, Software System Integration
and Architectural Analysis – A Case Study,
Proceedings of the International Conference on
Software Maintenance.
Lindström, Å., Johnson, P., Johansson, E., Ekstedt, M.,
Simonsson, M., 2004, A Study on CIO Concerns: Do
Enterprise Architecture Frameworks Support Them?,
Submitted to Information Systems Frontiers.
Linthicum D., 2000, Enterprise Application Integration,
Upper Saddle River, New Jersey, Addison Wesley.
Luftman, J., 2000, Assessing Business-IT alignment
maturity, Communications of the Association for
Information Systems, Vol. 4.
Mc Govern, J., et al, 2003, A practical Guide to Enterprise
Architecture
, Prentice Hall, Upper Saddle River.
The Open Group homepage, 2004, www.opengroup.org,
February 20.
The Open Group, 2003, The Open Group Architectural
Framework, Version 8, The Open Group.
Oskarsson, Ö., 1981, Mechanisms of Modifiability in
Large Software Systems, Dissertation, Software
Systems Research Center, Linköping University.
Ruh W., 2001, Enterprise Application Integration, Wiley.
Spewak, S., 1992, Enterprise Architecture Planning –
Developing a Blueprint for Data, Applications and
Technology, New York, John Wiley & Sons Inc.
Zachman, J.A., 1987, A Framework for Information
Systems Architecture”, IBM Systems Journal, Vol. 26,
No 3.
SCENARIO-BASED EVALUATION OF ENTERPRISE - A top-down approach for chief information officer decision
making
137
