
WAVELETS TRANSFORMS APPLIED TO TERMITE DETECTION
Carlos Garc
´
ıa Puntonet
Univ. Granada. Dept. ATC, ESII. Periodista Daniel Saucedo. E-18071-Granada-Spain
Juan Jos
´
e Gonz
´
alez de la Rosa
Univ. C
´
adiz. Electronics Area, EPSA. Ram
´
on Puyol S/N. E-11202-Algeciras-Spain
Isidro Lloret Galiana
Univ. C
´
adiz. Dpt. Computer Science, EPSA. Ram
´
on Puyol S/N. E-11202-Algeciras-Spain
Juan Manuel G
´
orriz S
´
aez
Univ. Granada. Dept. ECT, Fuentenueva S/N. E-18071. Granada. Spain
Keywords:
Acoustic emission, termite detection, ultrasonics, vibratory signal, seismic accelerometer, transient detection,
wavelets.
Abstract:
In this paper we present an study which shows the possibility of using wavelets to detect transients produced
by termites. Identification has been developed by means of analyzing the impulse response of three sensors
undergoing natural excitations. De-noising by wavelets exhibits good performance up to SNR=-30 dB, in the
presence of white gaussian noise. The test can be extended to similar vibratory or acoustic signals resulting
from impulse responses.
1 INTRODUCTION
In acoustic emission (AE) signal processing a custom-
ary problem is to extract some physical parameters of
interest in situations which involve join variations of
time and frequency. This situation can be found in
almost every nondestructive AE tests for character-
ization of defects in materials, or detection of spu-
rious transients which reveals machinery faults (Lou
and Loparo, 2004). The problem of termite detection
lies in this set of applications involving non-stationary
signals (de la Rosa et al., 2004b).
When wood fibers are broken by termites they pro-
duce acoustic signals which can be monitored using
ad hoc resonant acoustic emission (AE) piezoelectric
sensors which include microphones and accelerome-
ters, targeting subterranean infestations by means of
spectral and temporal analysis. The drawback is the
relative high cost and their practical limitations (de la
Rosa et al., 2004b).
The usefulness of acoustic techniques for detec-
tion depends on several biophysical factors. The
main one is the amount of distortion and attenua-
tion as the sound travels through the soil (∼600 dB
m
−1
, compared with 0.008 dB m
−1
in the air). Fur-
thermore, soil and wood are far from being ideal
acoustic propagation media because of their high
anisotropy and frequency dependent attenuation char-
acteristics (Mankin and Fisher, 2002). This is the rea-
son whereby signal processing techniques emerged as
an alternative.
Second order methods (spectra) failure in low SNR
conditions even with ad hoc piezoelectric sensors.
Bispectrum have proven to be a useful tool for char-
acterization of termites in relative noisy environments
using low-cost sensors (de la Rosa et al., 2004a),(de la
Rosa et al., 2004c). The computational cost could be
pointed out as the main drawback of the technique.
This is the reason whereby diagonal bispectrum have
to be used.
Numerous wavelet-theory-based techniques have
evolved independently in different signal process-
ing applications, like wavelets series expansions,
multiresolution analysis, subband coding, etc. The
wavelet transform is a well-suited technique to de-
tect and analyze events occurring to different scales
(Mallat, 1999). The idea of decomposing a signal
into frequency bands conveys the possibility of ex-
tracting subband information which could character-
ize the physical phenomenon under study (Angrisani
et al., 1999).
In this paper we show an application of wavelets’
de-noising possibilities for the characterization and
detection of termite emissions in low SNR condi-
tions. Signals have been buried in gaussian white
noise. Working with three different sensors we find
163
García Puntonet C., José González de la Rosa J., Lloret Galiana I. and Manuel Górriz Sáez J. (2005).
WAVELETS TRANSFORMS APPLIED TO TERMITE DETECTION.
In Proceedings of the Seventh International Conference on Enterprise Information Systems, pages 163-167
DOI: 10.5220/0002512101630167
Copyright
c
SciTePress
that the estimated signals’ spectra match the spectra
of the acoustic emission whereby termites are identi-
fied.
The paper is structured as follows: Section 2 sum-
marizes the problem of acoustic detection of termites;
Section 3 remembers the theoretical background of
wavelets; Section 4 describes the experiments carried
out. Conclusions are drawn in Section 5.
2 ACOUSTIC DETECTION OF
TERMITES
2.1 Characteristics Of The AE
Signals
Acoustic Emission(AE) is defined as the class of phe-
nomena whereby transient elastic waves are generated
by the rapid (and spontaneous) release of energy from
a localized source or sources within a material, or the
transient elastic wave(s) so generated (ASTM, F2174-
02, E750-04, F914-03
1
). This energy travels through
the material as a stress or strain wave and is typically
detected using a piezoelectric transducer, which con-
verts the surface displacement (vibrations) to an elec-
trical signal.
Termites use a sophisticated system of vibratory
long distance alarm. When disturbed in their nests
and in their extended gallery systems, soldiers pro-
duce vibratory signals by drumming their heads
against the substratum (R¨ohrig et al., 1999). The
drumming signals consist of pulse trains which propa-
gate through the substrate (substrate vibrations), with
pulse repetition rates (beats) in the range of 10-25 Hz,
with burst rates around 500-1000 ms, depending on
the species (Conn
´
etable et al., 1999). Soldiers pro-
duce such vibratory signals in response to disturbance
(1-2 nm by drumming themselves) by drumming their
head against the substratum. Workers can perceive
these vibrations, become alert and tend to escape.
Figure 1 shows one of the impulses in a burst and
its associated power spectrum is depicted in figure
2. Significant drumming responses are produced over
the range 200 Hz-10 kHz. The carrier (main com-
ponent) frequency of the drumming signal is around
2600 Hz.
The spectrum is not flat as a function of frequency
as one would expect for a pulse-like event. This is due
1
American Society for Testing and Materials. F2174-
02: Standard Practice for Verifying Acoustic Emission Sen-
sor Response. E750-04: Standard Practice for Characteriz-
ing Acoustic Emission Instrumentation. F914-03: Standard
Test Method for Acoustic Emission for Insulated and Non-
Insulated Aerial Personnel Devices Without Supplemental
Load Handling Attachments.
to the frequency response of the sensor (its selective
characteristics) and also to the frequency-dependent
attenuation coefficient of the wood and the air.
0.005 0.01 0.015 0.02 0.025 0.03
-0.6
-0.4
-0.2
0
0.2
0.4
0.6
Time (s)
Normalized amplitude
A single impulse in a burst
Figure 1: A single pulse of a four-pulse burst.
0 5 10 15 20 25 30 35 40 45
10
-9
10
-8
10
-7
10
-6
10
-5
10
-4
10
-3
10
-2
10
-1
10
0
Frequency (kHz)
Normalized power
Spectrum of a pulse
Figure 2: Normalized power spectrum of a single pulse.
2.2 Devices, Ranges Of
Measurement And HOS
Techniques
Acoustic measurement devices have been used pri-
marily for detection of termites (feeding and exca-
vating) in wood, but there is also the need of de-
tecting termites in trees and soil surrounding build-
ing perimeters. Soil and wood have a much longer
coefficient of sound attenuation than air and the co-
efficient increases with frequency. This attenuation
reduces the detection range of acoustic emission to 2-
5 cm in soil and 2-3 m in wood, as long as the sensor
is in the same piece of material (Mankin et al., 2002).
The range of acoustic detection is much greater at fre-
quencies <10 kHz, and low frequency accelerometers
ICEIS 2005 - HUMAN-COMPUTER INTERACTION
164

have been used to detect insect larvae over 1-2 m in
grain and 10-30 cm in soil (Robbins et al., 1991).
It has been shown that ICA success in separating
termite emissions with small energy levels in com-
parison to the background noise. This is explained
away by statistical independence basis of ICA, re-
gardless of the energy associated to each frequency
component in the spectra (de la Rosa et al., 2004c).
The same authors have proven that the diagonal bis-
pectrum can be used as a tool for characterization
purposes (de la Rosa et al., 2004a). With the aim
of reducing computational complexity wavelets trans-
forms have been used in this paper to de-noise cor-
rupted impulse trains.
3 THE WAVELET TRANSFORM
3.1 Continuous Wavelet Transform
(CWT)
A mother wavelet is a function ψ with finite energy
2
,
and zero average:
Z
+∞
−∞
ψ(t)dt = 0, (1)
This function is normalized
3
, kψk = 1, and is cen-
tered in the neighborhood of t=0.
ψ(t) can be expanded with a scale parameter a,
and translated by b, resulting the daughter functions
or wavelet atoms, which remain normalized:
ψ
a,b
(t) =
1
√
a
ψ
t − b
a
; (2)
The CWT can be considered as a correlation between
the signal under study s(t) and the wavelets (daugh-
ters). For a real signal s(t), the definition of CWT
is:
CW T s(a, b) =
1
√
a
Z
+∞
−∞
s(t)ψ
∗
t − b
a
dt; (3)
where ψ
∗
(t) is the complex conjugate of the mother
wavelet ψ(t), s(t) is the signal under study, a and b
are the scale and the position respectively (a ∈ ℜ
+
−
0, b ∈ ℜ). The scale parameter is proportional to the
reciprocal of frequency.
The expression for the modulus of CW T is:
|CW T s(a, b)| = k(a)
α
; (4)
2
f ∈ L
2
(ℜ), the space of the finite energy functions,
verifying
+∞
−∞
|f(t)|
2
dt < +∞.
3
kfk =
+∞
−∞
|f(t)|
2
dt
1/2
= 1.
where α is the so-called Lipschitz exponent and k is
a constant. Looking at equation 4 one can discrimi-
nate the signal from the noise by analyzing the local
maxima of |CW T s(a, b)| across the scales.
Any finite energy signal s(t) can be decomposed
over a wavelet orthogonal basis
4
of L
2
(ℜ) according
to:
s(t) =
+∞
X
j=−∞
+∞
X
n=−∞
hs, ψ
j,n
iψ
j,n
(5)
Each partial sum can be interpreted as the details vari-
ations at the scale a = 2
j
:
d
j
(t) =
+∞
X
n=−∞
hs, ψ
j,n
iψ
j,n
s(t) =
+∞
X
j=−∞
d
j
(t)
(6)
The approximation of the signal s(t) can be pro-
gressively improved by obtaining more layers or lev-
els, with the aim of recovering the signal selectively.
For example, if s(t) varies smoothly we can obtain
an acceptable approximation by means of removing
fine scale details, which contain information regard-
ing higher frequencies or rapid variations of the sig-
nal. This is done by truncating the sum in 5 at the
scale a = 2
J
:
s
J
(t) =
+∞
X
j=J
d
j
(t) (7)
3.2 Discrete Time Wavelet
Transform (DTWT)
In the DTWT the original signal passes through two
complementary filters and two signals are obtained
as a result of a downsampling process, correspond-
ing to the approximation and detail coefficients. The
lengths of the detail and approximation coefficient
vectors are slightly more than half the length of the
original signal, s(t). This is the result of the dig-
ital filtering process (convolution) (Angrisani et al.,
1999). The approximations are the high-scale, low-
frequency components of the signal. The details are
the low-scale, high-frequency components.
A tree-structure arrangement of filters allows the
subband decomposition of the signal. In each stage
of the filtering process the same two digital filters are
used: a highpass h
a
(·), the discrete mother, and its
mirror (lowpass) g
a
(·). All these filters have the same
relative bandwidth (ratio between frequency band-
width and center frequency). The results of the de-
composition can be expressed as:
DT W T s(j, n) =
N−1
X
k=0
h
j
(2
j+1
n − k)s(k), (8)
4
ψ
j,n
(t) =
1
√
2
j
ψ
t−2
j
n
2
j
(j,n)∈Z
2
WAVELETS TRANSFORMS APPLIED TO TERMITE DETECTION
165
where N is the number of samples in the signal, j is
the decomposition level, n is the time shifting. The
same arguments are valid for the process of recon-
struction.
3.3 Wavelet Packets (WP)
The WP method is a generalization of wavelet decom-
position that offers more possibilities of reconstruct-
ing the signal from the decomposition tree. If n is the
number of levels in the tree, WP methods yields more
than 2
2
n−1
ways to encode the signal. The wavelet
decomposition tree is a part of the complete binary
tree.
When performing a split we have to look at each
node of the decomposition tree and quantify the infor-
mation to be gained as a result of a split. An entropy
based criterion is used herein to select the optimal de-
composition of a given signal. We use an adaptative
filtering algorithm, based on the work by Coifman and
Wickerhauser (Coifman and Wickerhauser, 1992).
Functions that verify additivity-type property are
suitable for efficient searching of the tree structures
and node splitting. The criteria based on the entropy
match these conditions, providing a degree of ran-
domness in an information-theory frame. In this work
we used the entropy criteria based on the p-norm:
E(s) =
N
X
i
ks
i
k
p
; (9)
with p≤1, and where s(t) = [s
1
(t), s
2
(t), . . . , s
N
(t)]
in the signal of length N.
The results are accompanied by entropy calcula-
tions based on Shannon’s criterion:
E(s) = −
N
X
i
s
2
i
log(s
2
i
); (10)
with the convention 0 × log(0) = 0.
4 EXPERIMENTS AND
CONCLUSIONS
Two accelerometers (KB12V, seismic accelerometer;
KD42V, industrial accelerometer, MMF) and a stan-
dard microphone have been used to collect data from
termites in different places (basements, subterranean
wood structures and roots) using the sound card of a
portable computer and a sampling frequency of 96000
(Hz). These sensors have different sensibilities and
impulse response. This is the reason whereby we nor-
malize spectra.
The de-noising procedure was developed using a
sym8, belonging to the family Symlets (order 8),
which are compactly supported wavelets with least
asymmetry and highest number of vanishing moments
for a given support width. We also choose a soft
heuristic thresholding.
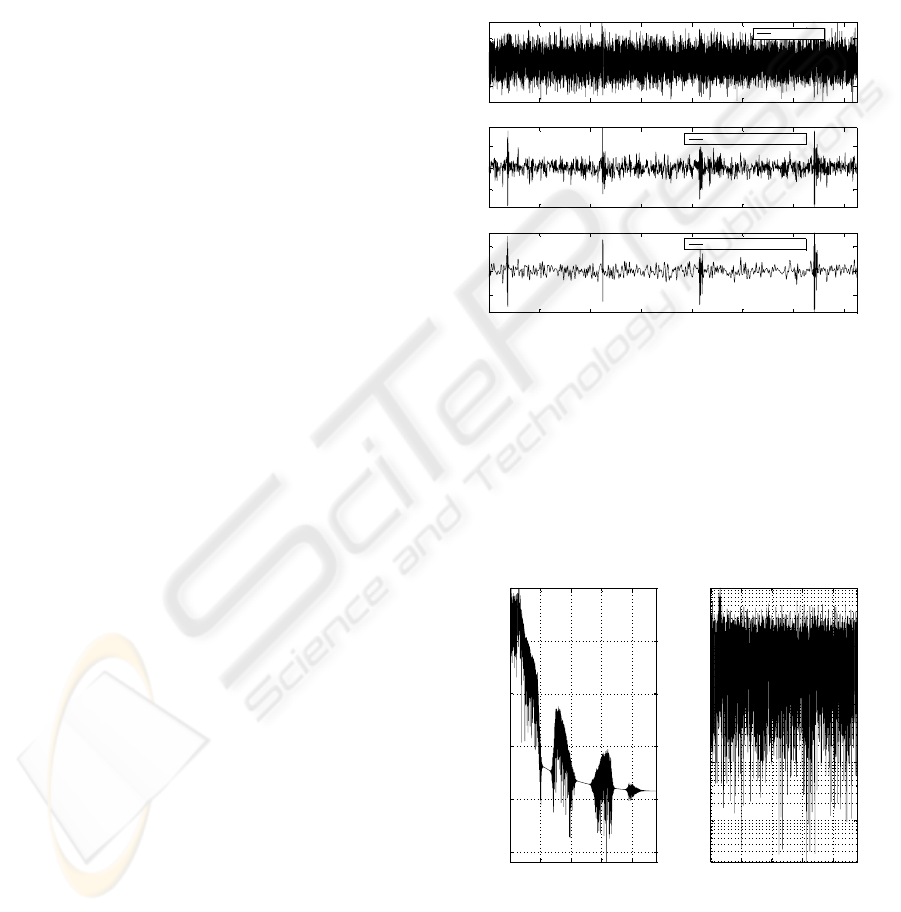
We used 15 registers (from reticulitermes grassei),
each of them comprises a 4-impulse burst buried in
white gaussian noise. De-noising performs success-
fully up to an SNR=-30 dB. Figure 3 shows a de-
noising result in one of the registers. Figure 4 shows
2000 4000 6000 8000 10000 12000 14000
-2
0
2
2000 4000 6000 8000 10000 12000 14000
-1
0
1
2000 4000 6000 8000 10000 12000 14000
-1
0
1
buried burst
de-noised signal at level 4
de-noised signal at level 5
Figure 3: Limit situation of the de-noising procedure
(SNR=-30 dB). From top to bottom: a buried 4-impulse
burst, estimated signal at level 4, estimated signal at level
5. Time resolution: 1/96000 (s)
a comparison between the spectrum of the estimated
signal at level 4 and the spectrum of the signal to be
de-noised, taking a register as an example. Significant
0 10 20 30 40
10
-10
10
-8
10
-6
10
-4
10
-2
10
0
Frequency (kHz)
Normalized power
Spectrum of the de-noised burst
0 10 20 30 40
10
-4
10
-3
10
-2
10
-1
10
0
Frequency (kHz)
Normalized power
Spectrum of the noisy burst
Figure 4: Spectra of the estimated signal and the buried
burst.
components in the spectrum of the recovered signal
are found to be proper of termite emissions.
ICEIS 2005 - HUMAN-COMPUTER INTERACTION
166

ACKNOWLEDGEMENT
The authors would like to thank the Spanish Gov-
ernment for funding the project DPI2003-00878, and
the Andalusian Autonomous Government Division for
funding the research with Contraplagas Ambiental
S.L.
REFERENCES
Angrisani, L., Daponte, P., and D’Apuzzo, M. (1999). A
method for the automatic detection and measurement
of transients. part i: the measurement method. Mea-
surement, 25(1):19–30.
Coifman, R. R. and Wickerhauser, M. (1992). Entropy-
based algorithms for best basis selection. IEEE Trans.
on Inf. Theory, 38(2):713–718.
Conn
´
etable, S., Robert, A., Bouffault, F., and Bordereau,
C. (1999). Vibratory alarm signals in two sympatric
higher termite species: Pseudacantotermes spiniger
and p. militaris (termitidae, macrotermitinae). Jour-
nal of Insect Behaviour, 12(3):90–101.
de la Rosa, J. J. G., Lloret, I., Puntonet, C. G., and G
´
orriz,
J. M. (2004a). Higher-order statistics to detect and
characterise termite emissions. Electronics Letters,
40(20):1316–1317. Ultrasosics.
de la Rosa, J. J. G., Puntonet, C. G., G
´
orriz, J. M., and
Lloret, I. (2004b). An application of ica to identify vi-
bratory low-level signals generated by termites. Lec-
ture Notes in Computer Science (LNCS), 3195:1126–
1133. Proceedings of the Fith International Confer-
ence, ICA 2004, Granada, Spain.
de la Rosa, J. J. G., Puntonet, C. G., and Lloret, I. (2004c).
An application of the independent component analy-
sis to monitor acoustic emission signals generated by
termite activity in wood. Measurement, In Press, Cor-
rected Proof, Available online 12 October 2004.
Lou, X. and Loparo, K. A. (2004). Bearing fault diagnosis
based on wavelet transform and fuzzy inference. Me-
chanical Systems and Signal Processing, 18(5):1077–
1095.
Mallat, S. (1999). A wavelet tour of signal processing. Aca-
demic Press, 2 edition.
Mankin, R. W. and Fisher, J. R. (2002). Current and po-
tential uses of acoustic systems for detection of soil
insects infestations. In Proceedings of the Fourth Sym-
posium on Agroacoustic, pages 152–158.
Mankin, R. W., Osbrink, W. L., Oi, F. M., and Anderson,
J. B. (2002). Acoustic detection of termite infesta-
tions in urban trees. Journal of Economic Entomology,
95(5):981–988.
R¨ohrig, A., Kirchner, W. H., and Leuthold, R. H.
(1999). Vibrational alarm communication in the
african fungus-growing termite genus macrotermes
(isoptera, termitidae). Insectes Sociaux, 46:71–77.
Robbins, W. P., Mueller, R. K., Schaal, T., and Ebeling, T.
(1991). Characteristics of acoustic emission signals
generated by termite activity in wood. In Proceedings
of the IEEE Ultrasonic Symposium, pages 1047–1051.
WAVELETS TRANSFORMS APPLIED TO TERMITE DETECTION
167
