
This work is supported in part by IRPA Grant from Government of Malaysia (Project ID#: 08-99-01-0028-EA024). It is
also funded through internal funds granted by Centre for Research and Postgraduate Programmes, Multimedia
University (Project ID#: PR/2002/0200).
A SYSTEM TO INTERPRET AND SUMMARISE SOME
PATTERNS IN IMAGES
Hema Nair
Faculty of Engineering and Technology, Multimedia University, Jalan Ayer Keroh Lama, Melaka 75450, Malaysia
Ian Chai
Faculty of Engineering, Multimedia University, Jalan Multimedia, 63100 Cyberjaya, Selangor, Malaysia
Keywords: Data mining, pattern recognition, fuzzy sets, genetic algorithm, linguistic summary, intelligent systems.
Abstract: In this paper, a system that is designed and implem
ented for automatic interpretation of some patterns in
satellite images is described. Some natural patterns such as land, island, water body, river, fire in remote-
sensed images are extracted and summarised in linguistic terms using fuzzy sets. A new graphical tool
(Multimedia University’s RSIMANA-R
emote-Sensing Image Analyser) developed for image analysis,
which is part of the system is also described in this paper.
1 INTRODUCTION
Knowledge discovery and data mining systems draw
upon methods and techniques from the field of
pattern recognition, as well as related topics in
database systems, artificial intelligence, machine
learning, statistics, and expert systems, where the
unifying goal is extracting knowledge from large
volumes of data (Friedman, Kandel, 1999). Pattern
recognition can be considered as a form of data
mining because both concentrate on the extraction of
information or relationships from data (Kennedy et
al., 1997). Many pattern classification techniques
have been proposed in literature. These include
neural nets, genetic algorithms (GA), Bayesian
methods, statistical methods, decision tables,
decision trees etc. A multimedia database system
(Thuraisingham, 2001) is an example of a
heterogeneous database system because it manages
heterogeneous data types such as audio, images,
video etc. Such data is typically unstructured in
format. In the past, many techniques for
representing, storing, indexing and retrieving
multimedia data have been proposed. However, the
area of multimedia mining has seen few results
(Zaine et al., 1998a), (Zaine et al., 1998b). This is
mainly due to the fact that multimedia data is not as
structured as relational data (Zaine et al., 1998b).
There is also the issue of diverse multimedia types
such as images, sound, video etc. While one method
of data mining may find success with one type of
multimedia such as images, the same method may
not be well suited to many other types of multimedia
due to varying structure and content. In (Zaine et al.,
1998a), (Zaine et al., 1998b), the objective is to mine
internet-based image and video. The results
generated could be a set of characteristic features
based on a topic (keyword), a set of association rules
which associate data items, a set of comparison
characteristics that contrast different sets of data, or
classification of data using keywords. Most of the
other related studies are confined to the data-filtering
step of the knowledge discovery process as defined
by (Shapiro et al., 1996). (Czyzewski, 1996) shows
how KDD methods could be used to analyse audio
data and remove noise from old recordings. In
(Chien et al., 1997), knowledge-based AI techniques
are used to assist image processing in a large image
database generated from the Galileo mission. In
(Bhandari et al., 1997), the authors combine a data
mining application with multimedia resources. They
use video clips to support the knowledge discovered
from a numerical database. (Blaschke et al., 2000)
describe some possible object-oriented segmentation
techniques in an integrated GIS/remote-sensing
environment. From another perspective, (Barnard et
283
Nair H. and Chai I. (2005).
A SYSTEM TO INTERPRET AND SUMMARISE SOME PATTERNS IN IMAGES.
In Proceedings of the Seventh International Conference on Enterprise Information Systems, pages 283-290
DOI: 10.5220/0002509902830290
Copyright
c
SciTePress
al., 2003a), (Barnard et al., 2003b) describe the
approach involved in matching images to text. Their
work describes models used for automatic image
annotation, browsing support and auto-illustration of
blocks of text. Such models are focussed on
prediction of words (from an available pool) that
match with specific image regions. This is a form of
labelling and requires assistance from training data
and manually annotated images.
This paper describes a system that classifies and
automatically interprets natural patterns such as
land, island, water body, river, fire in remote-sensed
images and utilises fuzzy logic (Nair, 2003), (Nair,
Chai 2004), (Nair, 2004) to describe these patterns.
Some feature descriptors such as area, length etc., of
such patterns are extracted and stored in a relational
database. Data mining techniques that employ
clustering and genetic algorithms are then used to
develop the most suitable linguistic summary of
each pattern/object stored in the database. This paper
is organised as follows. Section 2 describes the
system architecture, section 3 describes the
approach, section 4 discusses the implementation
issues, and section 5 discusses the conclusions and
future work.
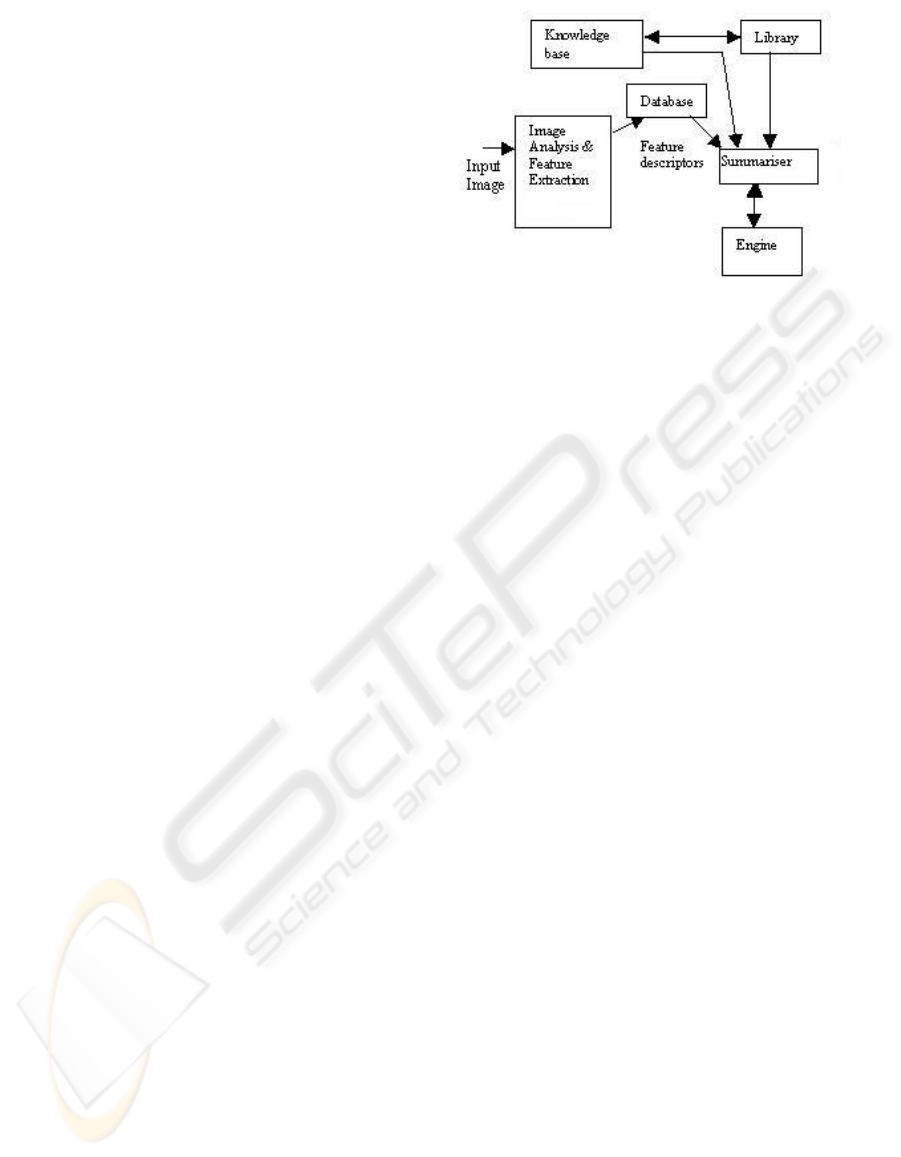
2 SYSTEM ARCHITECTURE
The system architecture is shown in Figure 1. The
input image is analysed using the graphical tool
developed as part of this research (RSIMANA) and
some feature descriptors extracted. These descriptors
are stored thereafter in a relational table in the
database. The knowledge base uses geographic facts
to define feature descriptors using fuzzy sets. It
interacts with a built-in library of linguistic labels,
which also interacts with the summariser as it
supplies the necessary labels to it. The summariser
receives input from these components and performs
a comparison between actual feature descriptors of
the image patterns stored in the database with the
feature definitions stored in the knowledge base.
After this comparison, the summariser uses the
linguistic labels supplied by the library to formulate
some possible summaries for each pattern/object in
the database. From among these summaries, the
most suitable one describing each pattern is selected
by interaction with the engine (genetic algorithm).
Figure 1: System architecture
RSIMANA is developed in Java®. Some of the
classes and algorithms developed as part of this tool
are described next. Euclidean distance measure is
used to calculate feature descriptors such as length
and perimeter. Area is calculated by means of a
pixel-counting algorithm. A morphology algorithm
is included to implement erosion of the binary-
thresholded image. Erosion can be used to locate the
centroid of an object/pattern, which is recorded for
use with the remainder of the system. The tool
includes a histogram feature to construct histogram
for a selected region of interest. Additional user-
friendly features are implemented such as zoom and
also scale to convert pixel area, length, and
perimeter to appropriate units.
The tool also aims to identify or classify patterns
such as river, land, island, other water body
(excluding river), fire in remote-sensed images
based on the attributes of their envelopes in the
image. Some of the attributes being considered are
grey level values, colour density slicing, histogram
distribution etc. This research focuses on analysing
multi-band (RGB) satellite images. The tool
implements only unsupervised pattern classification
at this stage. The following set of rules is developed
to perform pattern classification in multi-band
satellite images.
1. If a pattern/object is to be classified as an
island, it should have a water envelope
surrounding it such that it has a uniform
band ratio at at least eight points on this
envelope (corresponding to directions E,
W, N, S, NE, NW, SE, SW). Also grey
level values on the envelope could be lower
than the grey level values on the object.
2. If an object does not have an envelope in all
directions as described in rule (1) above,
then it is classified as land.
ICEIS 2005 - ARTIFICIAL INTELLIGENCE AND DECISION SUPPORT SYSTEMS
284

3. If an object is to be classified as water body
(expanse of water, river), it is necessary
that it should have a uniform band ratio.
4. Fire is classified as a separate pattern. It is
identified by applying colour density
slicing to the image and by viewing the
histogram of the affected area. The
histogram would show a majority of pixels
at lower intensity for the burnt scar area
near the fire.
This tool can analyse images in standard formats
such as tif, jpg, bmp, gif, png and generate the
recorded feature descriptors in delimited ASCII text
format.
3 APPROACH
Area, length and location (X, Y pixel co-ordinates of
centroid of pattern in image), and Additional
Information or Pattern Id, are the attributes of the
patterns/objects that are used to develop their
linguistic summaries. Area, length and location are
extracted automatically by RSIMANA. Additional
information contains the pattern’s id, which is
obtained by using the classification rules described
in the earlier section. The linguistic summary of
patterns/objects is evaluated as follows.
If
(1)
p21
y,...y,yY =
then
truth(y
i
isF)=µ
F
(y
i
):i=1,2,...,p, (2)
where µ
F
(y
i
) is the degree of membership of y
i
in
the fuzzy set F and 0 ≤ µ
F
(y
i
) ≤ 1. The linguistic
proposition y
i
is F could be instantiated as for
example, Island is small. Thus referring to equations
(1) and (2), y
i
could be island or area of land or
expanse of water or river. For each object y
i
, the
degree of membership of its feature descriptor such
as area or length in corresponding fuzzy sets is
calculated. An example of a typical linguistic
summary for land generated by the system in this
paper would be:
A fairly large area of land at the centre of the image.
In order to generate such summaries, it is necessary
to formulate fuzzy sets that quantify area/length
attributes of the object/pattern. Trapezoidal fuzzy
sets formulated for area are large, fairly large,
moderately large, and small and fuzzy sets for
length are long, relatively long, fairly long and short.
The linguistic description is calculated as follows:
njj2j1j
m...mmT ∧∧=
, (3)
where m
ij
is the matching degree (Kacprzyk,
Ziolkowski, 1986) of the ith attribute in the jth tuple.
m
ij
∈[0,1] is a measure of degree of membership of
the ith attribute value in a fuzzy set denoted by a
fuzzy label. The logical AND (∧) of matching
degrees is calculated as the minimum of the
matching degrees (Kacprzyk, Ziolkowski, 1986).
(4)
0mTT
ij
,
1j
j
≠∀=
∑
=
k
T in equation (4) is a numeric value that represents
the truth of a possible set of summaries of the k
objects in the database. The next section discusses
how the GA evolves the most suitable linguistic
summary for all the objects by maximising T.
4 IMPLEMENTATION ISSUES
This section explains the genetic algorithm approach
and then discusses the results from applying this
approach to analysing images.
4.1 GA Approach
A genetic algorithm emulates biological
evolutionary theories as it attempts to solve
optimisation problems (Filho et al., 1994),
(Goodman, 1996), (Smith et al., 1994). Each binary
chromosome string in a population represents a
possible linguistic summary for a pattern. Such a
population of strings is manipulated by selection,
cross-over and mutation operators in the GA (Filho
et al., 1994) such that as the GA evolves through
several generations, only those strings with highest
fitness survive. The evaluation or fitness function for
the linguistic summaries or descriptions of all
objects in the table is
f=max(T), (5)
where T is evaluated as shown in the previous
section and f is the maximum fitness value of a
particular set of linguistic summaries that has
evolved over several generations of the GA.
4.2 Results and discussion
In general, image objects/patterns are classified at
the highest level into land, water or fire. Land is
further classified into island and other land. Water is
A SYSTEM TO INTERPRET AND SUMMARISE SOME PATTERNS IN IMAGES
285
further classified into river and other water body.
The fuzzy sets that quantify area or length are
defined with reference to geographic facts such as:
• Largest continent is Asia with area of
44579000 km
2
• Largest freshwater lake is Lake Superior
with area of 82103 km
2
• Smallest continent is Australia/Oceania
with area of 7687000 km
2
• Longest river is the Nile with length 6669
km
A total of 29 fuzzy sets have been formulated in this
research. Formulation of these fuzzy sets is based on
the universal geographic facts given earlier. Only
some of the trapezoidal fuzzy sets formulated are
shown here due to space limitation. The fuzzy sets
for large expanse of water, fairly large expanse of
water and small expanse of water are formulated as
shown in equation (6), (7), and (8).
seofwaterlargeexpan
µ
(x)=1, for 82103≤ x
=x/2203 – 36.27, for 79900≤x≤ 82103
=0,x<79900 (6)
Probability of mutation = 0.001
watereexpanseoffairlylarg
=1-(100-x)/91, for 9≤ x≤ 100
µ
(x)=1, for 100≤ x≤900
=1-(x-900)/100, for 900≤ x≤ 1000
=0, x< 9
=0,x>1000 (7)
(x) = 1, 0≤x≤ 100
seofwatersmallexpan
=-x/900 +1.11, for 100≤x≤1000
µ
=0,otherwise (8)
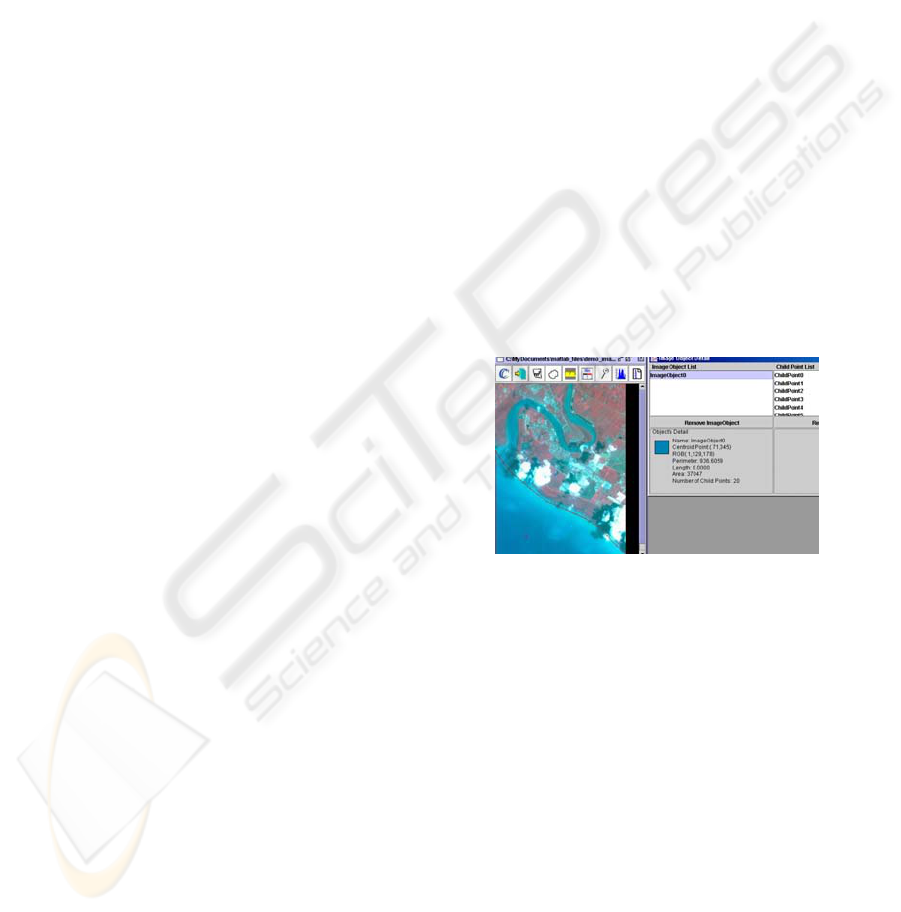
An example SPOT Multi-spectral satellite image to
be analysed is shown in Figure 2. Table 1 shows the
data collected from the image to perform k-means
clustering (Mather, 1999) in order to cluster the
pixels in the image. The feature vector used consists
of X, Y, R, G, B values. Table 2 shows a small
sample data set of feature descriptors
calculated/collected from the patterns in the image
using RSIMANA. The R band grey level at centroid
location of pattern is shown in the table, as this band
shows all patterns clearly. Area of each pattern is in
sq km. Length is in km. Pattern id attribute denotes
numbers as follows: 0=River, 1=Water Body,
2=Island, 3=Land, 4=Fire. Location is indicated by
X, Y pixel co-ordinates of centroid of pattern/object.
The additional information or pattern id attribute of
each object in Table 2 is calculated automatically
using the classification rules in Section 2, which
hold for multi-band images. For land, island, and
water body (expanse of water), area is the most
significant parameter in calculations and therefore
their length is ignored. A river’s length is its most
significant parameter in calculations and therefore
its area is ignored. This analysis uses only
unsupervised classification algorithms. In order to
extract more patterns such as different types of
vegetation, supervised classification is necessary for
which observational ground data is required for
training. Such data could not be afforded in this
research.
In Figure 2, the pattern or object that is selected as
ROI is the water body at the lower left. The frame
on the right shows the area and perimeter of the
pattern in pixel units and other information about the
pattern, which is collected/calculated by RSIMANA.
Thus data is calculated and collected for all the
patterns in the image in table 2.
The GA is run with following input parameter set.
These parameter values are set after several trial
runs.
Number of bits in a chromosome string of the
population = 10
Generations per cycle = 27
Population size = 200 strings
Probability of cross-over = 0.53
Figure 2: SPOT Multi-spectral image analysed by
RSIMANA. Approximate scale of image 1: 0.0194 sq km
After 216 generations, the linguistic summaries
generated for the data in Table 2 are:
• A short river at the centre
• A small area of land at the top left
• A small area of land at the right
• A small expanse of water at the lower left
Figure 3 shows another sample SPOT Multi-spectral
image, which is analysed by the system. The k-
means clustering table is Table 3 and the data
collected/calculated by RSIMANA is shown in table
4.
ICEIS 2005 - ARTIFICIAL INTELLIGENCE AND DECISION SUPPORT SYSTEMS
286
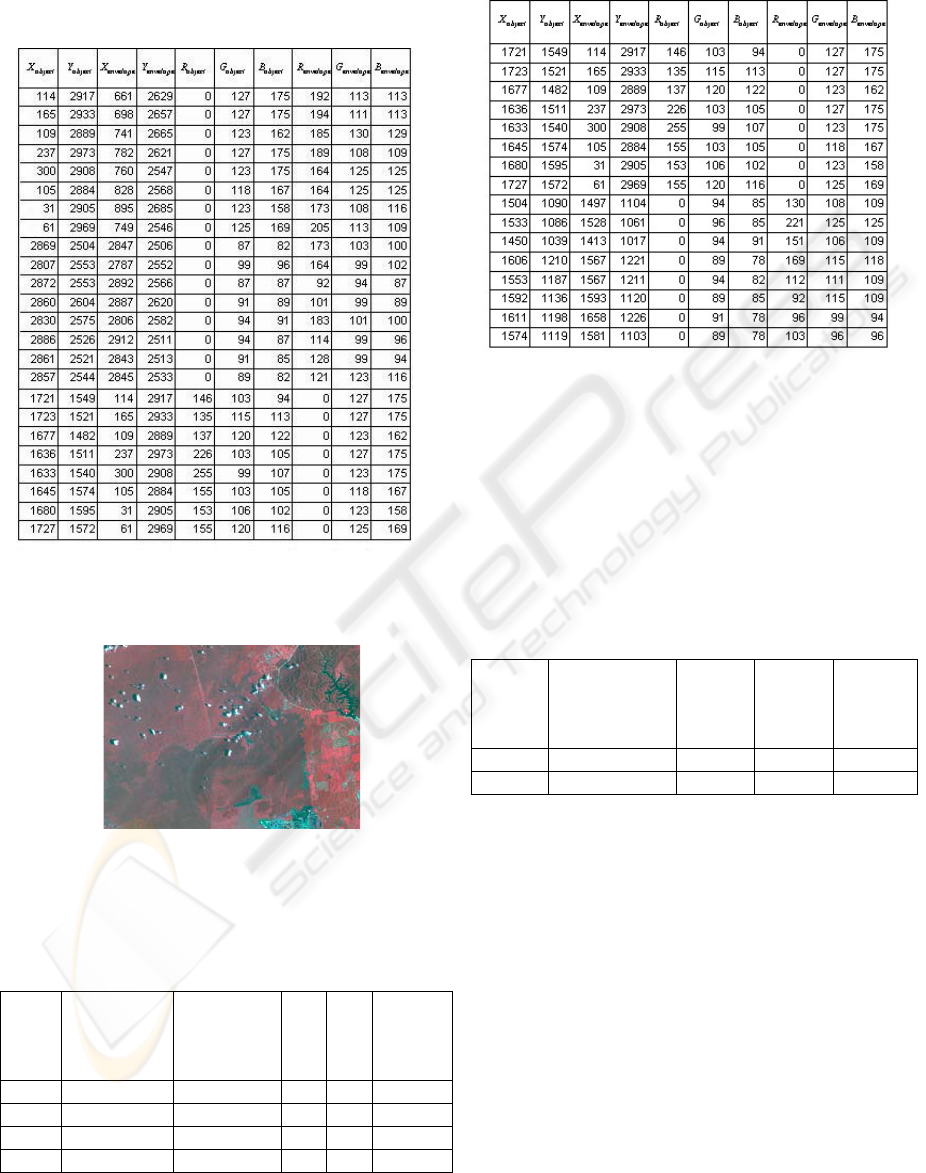
Table 1: Data collected from image in Figure 2 for
clustering. The header of the table denotes data from left
to right as follows: X
object,
Y
object,
X
envelope,
Y
envelope,
R
object,
G
object,
B
object,
R
envelope,
G
envelope,
B
envelope.
The corresponding output linguistic summaries from
the system are also shown.
Figure 3: SPOT Multi-spectral image analysed by
RSIMANA. Approximate scale of image 1: 0.0003764 sq
km. Image acquired on March 6, 1998
Table 2: Data calculated and collected from image in
Figure 2 using RSIMANA
Table 3: Data collected from image in Figure 3 for
clustering
For the data in Table 4 corresponding to image in
Figure 3, the GA is run with following input
parameter set. These parameter values are set after
several trial runs.
Number of bits in a chromosome string of the
population = 10
Generations per cycle = 26
Population size = 200 strings
Probability of cross-over = 0.53
Probability of mutation = 0.001
Table 4: Data calculated and collected from image in
Figure 3 using RSIMANA
R-
band
grey
level
Approximate
Area in sq
km
X Y Pattern
Id
150 3300.84 1606 1457 3
0 6.683 1546 1132 1
After 208 generations, the linguistic summaries
generated are:
• A small area of land at the centre.
• A small expanse of water at the top right.
Figure 4 shows yet another sample SPOT Multi-
spectral image of the same geographic area as in
Figure 3 but acquired on a later date, which is
analysed by the system. The k-means clustering
table is Table 5 and the data collected/calculated by
RSIMANA is shown in Table 6. The corresponding
output linguistic summaries from the system are also
shown.
R-
band
grey
level
Approximate
Area in sq km
Approximate
Length in km
X Y Pattern
Id
7 0 8.94 174 150 0
141 17.93 - 243 224 3
126 4.18 - 68 20 3
0 13.4 - 48 341 1
A SYSTEM TO INTERPRET AND SUMMARISE SOME PATTERNS IN IMAGES
287
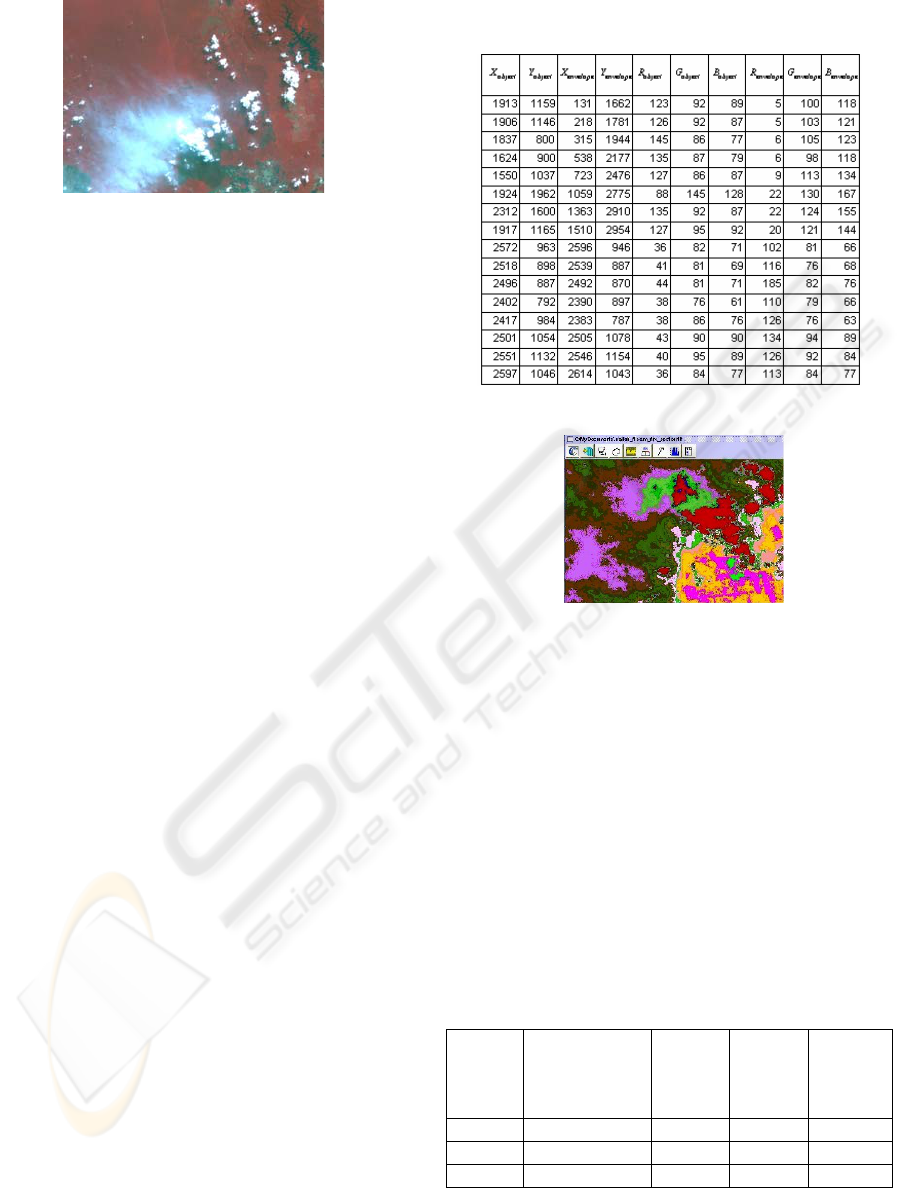
Figure 4: SPOT Multi-spectral image analysed by
RSIMANA. Approximate scale of image 1: 0.0003764 sq
km. Image acquired on July 10, 2001
The GA is run with following input parameter set.
These parameter values are set after several trial
runs.
Number of bits in a chromosome string of the
population = 10
Generations per cycle = 27
Population size = 200 strings
Probability of cross-over = 0.53
Probability of mutation = 0.001
After 216 generations, the linguistic summaries
generated for the data in Table 6 are:
• Bluish white smoke indicating fire at the
left
• A small expanse of water at the top right
• A small area of land at the centre
If the number of fuzzy labels and fuzzy sets are
increased, then the number of possible summaries
generated could also be increased. The GA can
search for an optimal solution among these
descriptions within a very short time.
The colour density sliced image corresponding to the
fire and smoke region in Figure 4 is shown in Figure
5. It shows the smoke plume from the fire
prominently. Figures 6 and 7 show the R-band
histograms corresponding to the area in Figures 3
and 4 where fire is detected (image in Figure 4
acquired on a later date). It can be seen clearly from
the histogram (Figure 7) that majority of the pixels
are of lower intensity corresponding to the burnt scar
near the fire, while this phenomenon is not indicated
in the histogram of the image of the same area
before the fire (Figure 6).
The summaries produced by this system have been
verified to be correct using topographic maps of the
areas in the images. The system thus generates the
same summaries automatically as would be obtained
by manual interpretation. In general, as RSIMANA
is a user-interactive tool, it is limited by the accuracy
of the user’s point and click action
Table 5: Data collected from image in Figure 4 for
clustering
Figure 5: Colour density sliced image corresponding to
Figure 4
5 CONCLUSIONS AND FUTURE
WORK
This paper has presented a new system for automatic
interpretation of multi-band remote-sensed images
by extracting and classifying some natural patterns
such as land, island, water body, river, fire and
describing these patterns using linguistic summaries.
A genetic algorithm technique has been employed to
evolve the most suitable linguistic summary that
describes each object/pattern
Table 6: Data calculated and collected from image in
Figure 4 using RSIMANA
R-
band
grey
level
Approximate
Area sq km
X Y Pattern
Id
150 2874.38 1899 1150 3
27 6.683 2506 976 1
166 - 1550 1587 4
ICEIS 2005 - ARTIFICIAL INTELLIGENCE AND DECISION SUPPORT SYSTEMS
288
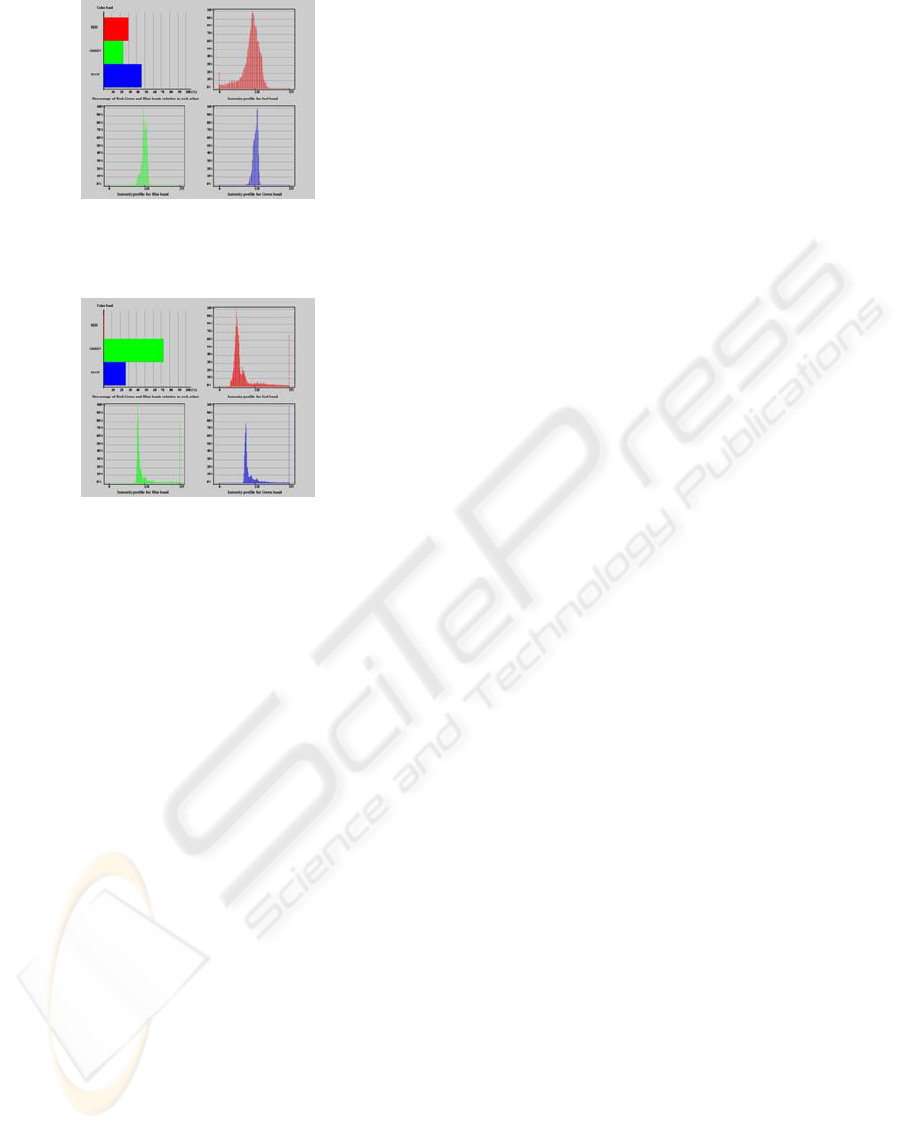
Figure 6: Histogram of area near fire before the fire
occurred corresponding to image in Figure 3
Figure 7: Histogram of area near fire and smoke
corresponding to image in Figure 4
in the database. This method can be extended to an
array of images of the same geographic area, taken
over a period of several years, to describe many
interesting and unusual patterns that emerge over
time. Some directions for future work include:
1. Adding the provision to upload ground data
in order to help classify more patterns such
as vegetation using supervised
classification techniques. Currently only
unsupervised classification is used.
2. Adding enhancements to image analysis
functions in RSIMANA.
3. As a future application, it would be
possible to construct an index for an image
database using the linguistic summaries
developed here.
4. Adding more fuzzy sets and corresponding
labels in knowledge base and library
respectively to have a system that is richer
and can generate a wider variety of
linguistic summaries.
5. Adding a scripting feature that allows the
user to program a sequence of image
analysis instructions in RSIMANA in a
user-friendly language.
6. Expanding the system to test application
domains other than remote-sensing
REFERENCES
Barnard, K., Duygulu, P., Forsyth, D., De Freitas, N., Blei,
D.M., Jordan, M.I., 2003a. Matching words and
pictures. Journal of Machine Learning Research, Vol
3, pp. 1107-1135.
Barnard, K., Duygulu, P., Forsyth, D., 2003b. Recognition
as translating images into text. Internet Imaging IX,
Electronic Imaging.
Bhandari, I., Colet, E., Parker, J., Pines, Z., Pratap, R.,
1997. Advanced scout: Data mining and knowledge
discovery in NBA data. Data Mining and Knowledge
Discovery, 1(1), pp. 121-125.
Blaschke, T., Lang, S., Lorup, E., Strobl, J., Zeil, P., 2000.
Object-oriented image processing in an integrated
GIS/remote-sensing environment and perspectives for
environmental applications, Cremers A, Greve K, eds,
Environmental Information for Planning, Politics and
the Public, pp. 555-570, Metropolis-Verlag, Marburg,
Volume 2.
Chien, S., Fisher, F., Mortenson, H., Lo, E., Greeley, R.,
1997. Using artificial intelligence planning to
automate science data analysis for large image
databases. In Proceedings Third International
Conference on Knowledge Discovery and Data
Mining, pp. 147-150.
Czyzewski, A., 1996. Mining knowledge in noisy audio
data. In Proceedings Second International Conference
on Knowledge Discovery and Data Mining, pp. 220-
225.
Filho, J.L.R., Treleaven, P.C., and Alipi, C., 1994. Genetic
Algorithm programming environments. In IEEE
Computer, pp. 28-43
Friedman, M., Kandel, A., 1999. Introduction to pattern
recognition – Statistical, structural, neural and fuzzy
logic approaches, World Scientific.
Goodman E.D., 1996. An Introduction to Galopps-the
Genetic ALgorithm Optimized for Portability and
Parallelism System(Release 3.2). Technical Report
No. 96-07-01, Genetic Algorithms Research and
Applications Group, Michigan State University.
Kacprzyk, J., Ziolkowski, A., 1986. Database queries with
fuzzy linguistic quantifers. In IEEE Transactions on
Systems, Man and Cybernetics, pp. 474-479.
Kennedy, R.L., Roy, B.V., Reed, C.D., Lippman, R.P.,
1997. Solving Data Mining problems through Pattern
Recognition, Prentice Hall.
Mather, P. M., 1999. Computer Processing of Remotely-
Sensed Images, Wiley.
Nair, H., 2003. Developing linguistic summaries of
patterns from mined images. In Proceedings of
International Conference on Advances in Pattern
Recognition, pp. 261-267.
Nair, H., Chai, I., 2004. Linguistic description of patterns
from mined images. In Proceedings of 6
th
A SYSTEM TO INTERPRET AND SUMMARISE SOME PATTERNS IN IMAGES
289

International Conference on Enterprise Information
Systems, Vol 2, pp. 77-83.
Nair, H., 2004. Linguistic summaries of image patterns.
Ruan D., D’hondt P., De Cock M., Nachtegael M.,
Kerre E.E., eds, Applied Computational Intelligence,
pp. 246-249, World Scientific.
Shapiro, G.P., Fayyad, U., Smith, P., 1996. From data
mining to knowledge discovery: An overview. Fayyad
U. M., Shapiro G.P, Smith P, Uthurusamy R, eds,
Advances in Knowledge Discovery and Data Mining,
pp. 1-35, AAAI/MIT Press.
Smith, R.E., Goldberg, D.E., Earickson, J.A., 1994. SGA-
C:A C-language implementation of a Simple Genetic
Algorithm. TCGA Report No.91002.
Thuraisingham, B., 2001. Managing and Mining
Multimedia Databases, CRC Press.
Zaine, O.R, Han, J., Ze-Nian, L., Hou, J., 1998a. Mining
Multimedia Data. CASCON’98 : Meeting of Minds,
pp. 83-96
Zaine, O.R., Han, J., Ze-Nian, L., Chee, S.H., Chiang,
J.Y., 1998b. MultimediaMiner : A System Prototype
for Multimedia Data Mining. In Proceedings of ACM-
SIGMOD International Conference on Management of
Data (SIGMOD ’98).
ICEIS 2005 - ARTIFICIAL INTELLIGENCE AND DECISION SUPPORT SYSTEMS
290
