
AN AUTOMATIC BLIND MODULATION RECOGNITION
ALGORITHM FOR M-PSK SIGNALS BASED ON MSE CRITERION
M. Vastram Naik, A. Mahanta, R. Bhattacharjee and H. B. Nemade
Department of Electronics and Communication Engineering, Indian Institute of Technology, Guwahati, Assam , 781039, India
Keywords:
Automatic Blind Modulation Recognition (ABMR), Mean Square Error power (MSE), Mean Square Error
Difference (MSED), Threshold On Moment (TOM), Constant Modulus Algorithm (CMA), Tapped Delay
Line filter (TDL).
Abstract:
This paper addresses Automatic Blind Modulation Recognition (ABMR)problem, utilizing a Mean Square
Error (MSE) decision rule to recognize and differentiate M-ary PSK modulated signals in presence of noise
and fading. The performance of the modulation recognition scheme has been evaluated by simulating dif-
ferent types of PSK signals. By putting appropriate Mean Square Error Difference Threshold (MSEDT) on
Mean Square Error (MSE), the proposed scheme has been found to recognize the different modulated signals
with 100% recognition accuracy at Signal to Noise Ratio (SNR) as low as 1 dB in AWGN channels. The
data samples required to be used for performing recognition is very small, thereby greatly reducing the time
complexity of the recognizer. For fading signal Constant Modulus (CM) equalization has been applied prior
to performing recognition. It has been observed that when CM equalization is used, 100 % recognition can be
achieved at SNR as low as 6 dB.
1 INTRODUCTION
Automatic blind modulation recognition has its roots
in military communication intelligence applications.
In literature, most recognition method proposed
initially were designed for recognizing analog mod-
ulations. The recent contributions in this area deal
with recognition of digitally modulated signals as
now a days digital modulation schemes are employed
in almost all form of communication systems. With
the rising development in software defined radio
(SDR) systems, automatic modulation recognition
has gained more attention than ever. Automatic
recognizer units can act as front-end to SDR systems
before demodulation takes place. Thus a single SDR
system can robustly handle multiple modulations,
therefore modulation recognition is an important
issue for SDR systems. Many techniques have been
reported in literature for AMR. Early works on modu-
lation recognition can be found in a report by Weaver,
Cole, Krumland and Miller (Weaver et al., 1969)
where the authors use frequency domain parameters
to distinguish between analog modulation types. In
the area of recognition of digitally modulated signal,
the paper by Liedtke (Liedtke, 1984) is a well-known
early work. The author presented results based on
a statistical analysis of various signal parameters to
discriminate between amplitude shift keying (ASK),
Frequency Shift Keying (FSK), and Phase Shift
Keying (PSK) signals. A variety of techniques such
as Artificial Neural Network (ANN) (Wong and
Nandi, 2004), (Halmi and Abdalla, 2003), constel-
lation shape (Mobasseri, 2000), Statistical moment
matrix method (Azzouz and Nandi, 1996b), maxi-
mum likelihood (Wei and Mendel, 1999), (Boiteau
and Martret, 1998), zero crossing detection (Hsue
and Soliman, 1990), pattern recognition (Weaver
et al., 1969), (Halmi and Abdalla, 2003) and their
combinations have been used for AMR. Especially,
there are few threshold-based techniques (Wong and
Nandi, 2004), (Azzouz and Nandi, 1996b), (Soliman
and Hsue, 1992) to estimate modulation schemes.
For such schemes, the threshold level becomes SNR
dependant and hence threshold setting is difficult
under variable SNR scenario.
In this paper, we have proposed a method based
on MSE decision rule to recognize received M-PSK
modulated signals. In this method we compute MSE
between the prototype message points stored in the
13
Vastram Naik M., Mahanta A., Bhattacharjee R. and Nemade H. (2005).
AN AUTOMATIC BLIND MODULATION RECOGNITION ALGORITHM FOR M-PSK SIGNALS BASED ON MSE CRITERION.
In Proceedings of the Second International Conference on e-Business and Telecommunication Networks, pages 13-19
DOI: 10.5220/0001419400130019
Copyright
c
SciTePress
receiver library and the received signal points. Classi-
fication is made by computing the differences in MSE
of different PSK signals against specified threshold
values obtained through extensive simulation. The
performance of the proposed algorithm has been eval-
uated for digitally modulated M-PSK signals. As in
(Wei and Mendel, 1999), (Halmi and Abdalla, 2003)
and (Umebayashi et al., 2000), we have assumed per-
fect symbol and carrier synchronization while evalu-
ating the performance of the scheme. The rest of the
paper is organized as follows, Section-2 describes the
effect of channel on constellation points. The pro-
posed blind modulation recognition algorithm is pre-
sented in section-3. Simulation results are presented
in section-4. Conclusions are drawn in section-5.
2 EFFECT OF AWGN AND
FADING CHANNEL ON
CONSTELLATION POINTS
In AWGN channel, the received bandpass signal in
the k-th signaling interval may be written as
r(t, k) = s
m
(t, k) + n(t, k),
k T
s
≤ t ≤ (k + 1) T
s
where T
s
: symbol duration, s
m
(t) is the message
waveform corresponding to the M-PSK symbol s
m
,
m = 1, 2, 3,.....M . Assuming perfect carrier synchro-
nization and timing recovery as in [8, 12, 14] and em-
ploying I-Q demodulation we get
r(k) = [r
I
(k), r
Q
(k)]
= [s
mI
+ n
I
(k), s
mQ
+ n
Q
(k)]
Thus in the signal space the received signal points
wander around signal points in a completely random
fashion, in the sense it may lie anywhere inside a
Gaussian distributed noise cloud centered on the mes-
sage point. The effect of Additive White Gaussian
Noise on signal points for MPSK signals at the re-
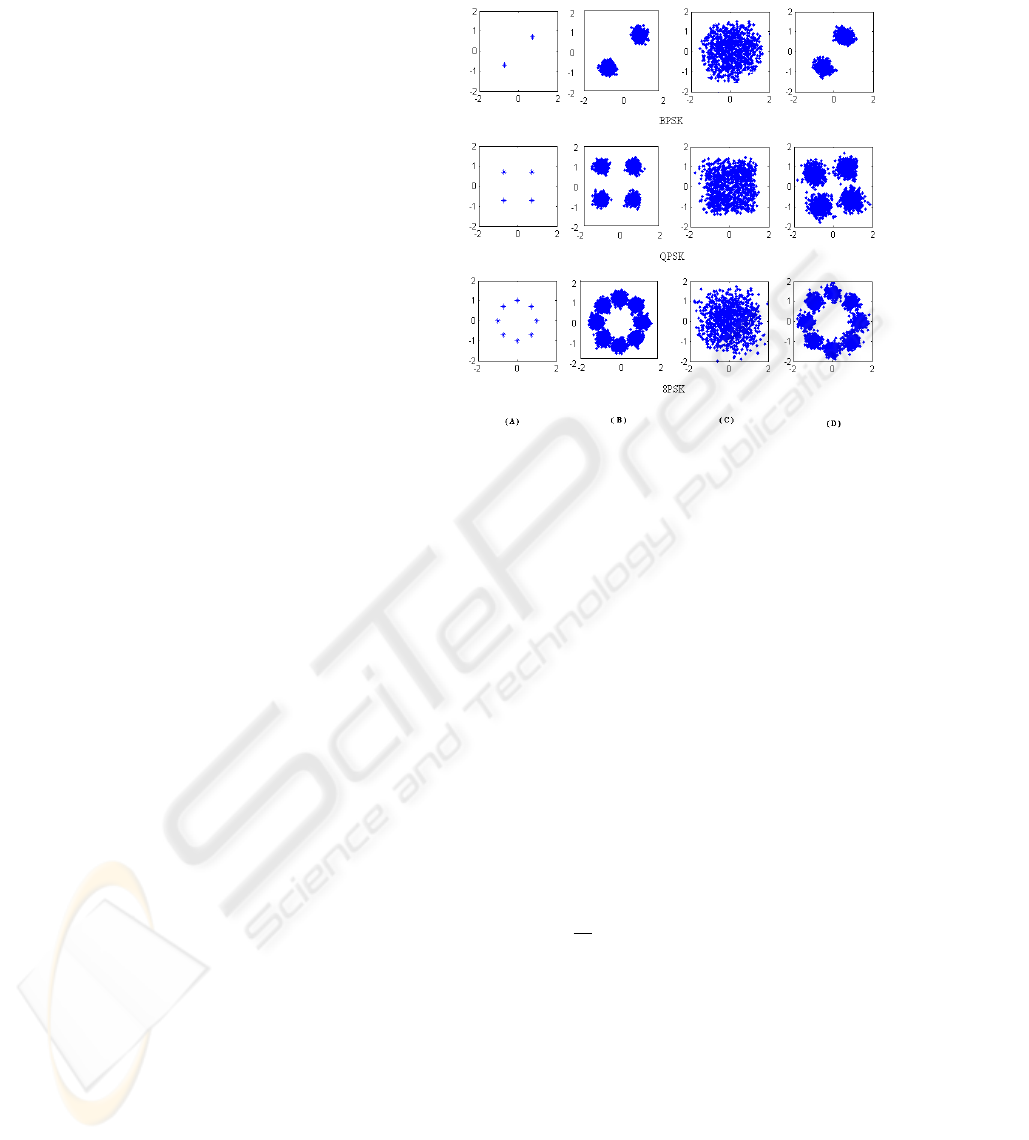
ceiver is shown in Figure 1(B). For wireless commu-
nication scenarios, in addition to AWGN, there will be
the effect of multipath fading. Multipath fading chan-
nel can be modelled by a Tapped Delay Line(TDL)
(Proakis, 2001): the test signal is convolved with the
impulse response of the TDL to account for the effect
of fading that is induced by the channel. The TDL
parameters are chosen corresponding to power delay
profile of physical channels (Chen and Chng, 2004).
Figure 1(C) and Figure 1(D) respectively shows the
faded received signal constellation and equalized sig-
nal constellation after CM equalization.
Figure 1: Effect of Noise and Fading on MPSK constella-
tion at SNR=15 dB, (A) Prototype signal points, (B) Re-
ceived noisy signal constellation, (C) Received noisy and
faded signal constellation (D) Equalized constellation
3 PROPOSED METHOD FOR
AUTOMATIC BLIND
MODULATION RECOGNITION
A sequence of N received signal samples {r(k)}, k =
1, 2, ....N, are collected at demodulator output. Using
this sequence, we check how closely the received sig-
nal samples “match” with each of the prototype con-
stellations available at the receiver library. The degree
of “closeness” or “match” is measured in terms of a
Mean Square Error power defined as
MSE(M) =
1
N
N
X
k=1
D
2
k, M
, M = 2
q
, q = 1, 2, ....
where
D
k, M
= min
m
{| r(k) − s
m
|}, m = 1, 2, ...M
= min
m
{| d
k, m
|}
The computation of D
k,M
can be simplified by
confining the search to that quadrant in which r(k)
lies. For example, as shown in Figure 2, as r(k) lies
in first quadrant (Q
1
), we need to compute only the
distances d
k, 1
, d
k, 2
and d
k, 3
to find D
k, 8
.
We make the following observations:
ICETE 2005 - WIRELESS COMMUNICATION SYSTEMS AND NETWORKS
14

Lower-order PSK constellations are sub-sets of the
higher-order PSK schemes; therefore, when lower-
order PSK symbols are transmitted, the received
signal sequence {r(k)} will find a “match” not only
with the corresponding prototype constellation, it
will also “match” with the higher-order constellation(
with more or less the same degree of accuracy).
Case 1 BPSK is transmitted
In this case, the received signal points will be
scattered around the symbols s
2
and s
6
shown in
Figure1.
(a) Majority of the points will be confined in the
first and the third quadrants (Q
1
and Q
3
) especially
at high SNR. The contribution of these points to-
wards MSE power will be the same in both BPSK
and QPSK , i.e.
MSE(2) = M SE(4),
∀ r(k) ∈ Q
1
∪ Q
3
However, this same set of points will result in
a slightly lower MSE when matched to 8-PSK as
some of these points will have closer match to 8-PSK
symbols s
1
or s
3
and s
5
or s
7
shown in Figure 2.
Thus,
MSE(8) < M SE(2), MSE(4),
∀ r(k) ∈ Q
1
∪ Q
3
(b) For a small fraction of the received points
which lie in Q
2
and Q
4
, their ‘match’ with the BPSK
prototype will be proper (the nearest symbols being
s
2
and s
6
) as compared to QPSK prototype (nearest
symbols s
4
and s
8
) and 8-PSK (nearest symbols s
3
,
s
4
, s
5
and s
7
, s
8
, s
1
). Thus,
MSE(8) < M SE(4) < M SE(2),
∀ r(k) ∈ Q
2
∪ Q
4
Conclusions:
(i) when BPSK is transmitted, at any SNR , we
shall find MSE(8) < M SE(4) < M SE(2)
(ii) at high SNR , the differences in MSE are
negligibly small; only at low SNR , the differences
are distinguishable, it is shown in Figure 3.
Case 2 QPSK is transmitted
Now {r(k)}
′
s are scattered around the four sym-
bols s
2
, s
4
, s
6
, s
8
. It follows that {r(k)} will match
well with QPSK and 8-PSK prototypes while there
will be large mismatch with BPSK prototype. Thus,
MSE(2) > M SE(4), MSE(8) at all SNR
MSE(8) ≈ M SE(4) at high SNR
MSE(8) < M SE(4) at low SNR
This is shown in Figure 4.
Case 3 8-PSK is transmitted
Following similar reasonings we conclude
MSE(2) ≫ M SE(4) ≫ M SE(8) at all SNR.
The three curves are now well-separated, it is
shown in Figure 5.
Proposed Algorithm
Step 1
Check for constant envelope property by com-
puting fourth order moment of the received signal
over a few samples, and compare with a Threshold
On Moment(TOM), denoted by λ
M
to distinguish
between M-PSK and M-QAM signals.
m =
1
N
N
X
k =1
| r(k) |
4
where N is number of received signal samples
considered.
Step 2
Observation space is partitioned into four quad-
rants, named as Q
1
, Q
2
, Q
3
, Q
4
. Check signs of
received signal points [r
I
(k), r
Q
(k)] to know to
which quadrant it belongs:
If signs of real and imaginary part are +, + ⇒ Q
1
If signs of real and imaginary part are −, + ⇒ Q
2
If signs of real and imaginary part are −, − ⇒ Q
3
If signs of real and imaginary part are +, − ⇒ Q
4
Step 3
AN AUTOMATIC BLIND MODULATION RECOGNITION ALGORITHM FOR M-PSK SIGNALS BASED ON MSE
CRITERION
15

Figure 2: Distance vector calculation for M-PSK signals
(a) Compute
D
k, 2
= | r(k) − s
m
|,
m = 2 if r(k) ∈ Q
1
m = 6 if r(k) ∈ Q
3
D
k, 2
= min
m
{| r(k) − s
m
|},
m = 2, 6 if r(k) ∈ Q
2
or Q
4
D
k, 4
= | r(k) − s
m
|,
m = 2 if r(k) ∈ Q
1
m = 4 if r(k) ∈ Q
2
m = 6 if r(k) ∈ Q
3
m = 8 if r(k) ∈ Q
4
D
k, 8
= min
m
{| r(k) − s
m
|},
m = 1, 2, 3 if r(k) ∈ Q
1
m = 3, 4, 5 if r(k) ∈ Q
2
m = 5, 6, 7 if r(k) ∈ Q
3
m = 7, 8, 1 if r(k) ∈ Q
4
(b). Compute
MSE(M) =
1
N
N
X
k =1
D
2
k, M
, M = 2, 4, 8
Step 4
Compute Mean Square Error Difference(MSED)
MSED
2−4
= MSE(2) − M SE(4)
MSED
4−8
= MSE(4) − M SE(8)
Step 5
Decision rule ( compare with thresholds deter-
mined through simulation):
(i) If MSED
2−4
< λ
2−4
, declare BPSK is
transmitted
(ii) If MSED
2−4
> λ
2−4
, then check if
MSED
4−8
< λ
4−8
. If MSED
4−8
< λ
4−8
, declare
QPSK is transmitted.
(iii) If M SED
4−8
> λ
4−8
, declare 8-PSK is trans-
mitted.
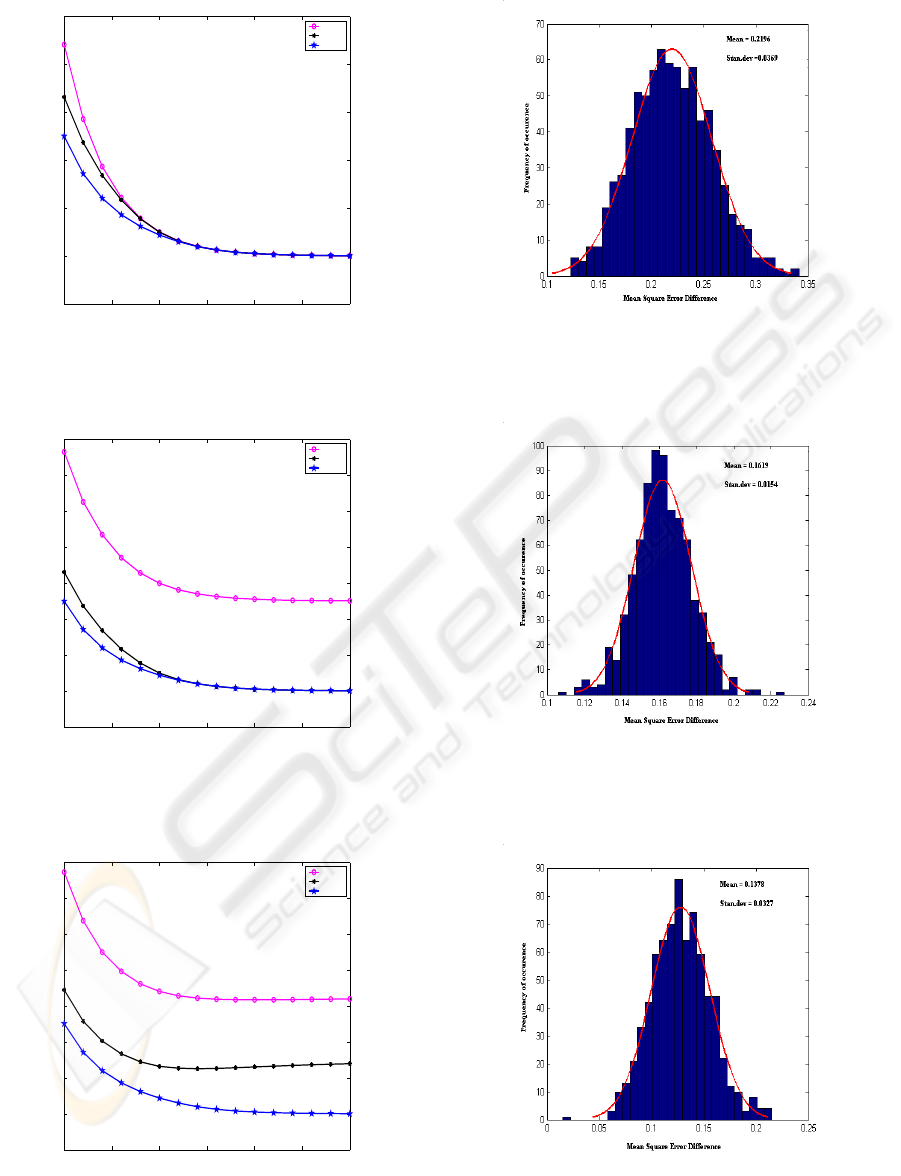
4 SIMULATION RESULTS
Manto-carlo simulation runs were carried out with N
= 250 samples at SNR ranging from 0 dB to 30 dB.
Average values of MSEs obtained from 800 such runs
at each SNR are plotted in Figures 3-5 (in AWGN
channel) and Figures 10-12 (in fading channels) for
the three cases (e.g BPSK, QPSK and 8-PSK).
Determination of the thresholds λ
a
2−4
, λ
a
4−8
,
λ
f
2−4
and λ
f
4−8
.
For AWGN channel:
Figure 6 shows the distribution of MSED
2−4
at SNR = 0 dB. The distribution is approximately
Gaussian. We set λ
a
2−4
= µ
2−4
+ σ
2−4
= 0.2196 +
0.0369 = 0.2565. The distribution of MSED
4−8
is shown in Figure 7, from where we obtain
λ
a
4−8
= µ
4−8
+ σ
4−8
= 0.1619 + 0.0154 = 0.1773.
With these thresholds we have observed 100%
recognition in all three cases at SNR ≥ 1 dB in
AWGN channel.
For fading channel:
Figure 8 and Figure 9 show the distribution of
MSED
2−4
at SNR = 3 dB and M SED
4−8
at SNR
= 5 dB respectively. Following the same procedure,
the thresholds obtained for fading channel are λ
f
2−4
= µ
2−4
+ σ
2−4
= 0.1378 + 0.0327 = 0.1705 and
λ
f
4−8
= µ
4−8
+ σ
4−8
= 0.1069+ 0.0121 = 0.1190 re-
spectively. With these thresholds, 100% recognition
is achieved in fading channel at SNR ≥ 6 dB.
5 CONCLUSION
In this paper we have presented a novel approach to
automatic digital modulation recognition of M-PSK
signals. The performance of the proposed scheme has
been tested in AWGN and fading channels. Simu-
lation results show that the proposed scheme gives
a much higher recognition performance for MPSK
signals compared to the methods reported in litera-
ture (Wong and Nandi, 2004), (Azzouz and Nandi,
1996a), (Mobasseri, 1999), (Umebayashi et al., 2000)
ICETE 2005 - WIRELESS COMMUNICATION SYSTEMS AND NETWORKS
16
0 5 10 15 20 25 30
−0.2
0
0.2
0.4
0.6
0.8
Signal−to−Noise Ratio
Mean Square Error
BPSK
QPSK
8−PSK
Figure 3: Characteristics of BPSK signal in an AWGN
channel
0 5 10 15 20 25 30
−0.2
0
0.2
0.4
0.6
0.8
1
1.2
Signal−to−Noise Ratio
Mean Square Error
BPSK
QPSK
8−PSK
Figure 4: Characteristics of QPSK signal in an AWGN
channel
0 5 10 15 20 25 30
−0.2
0
0.2
0.4
0.6
0.8
1
1.2
Signal−to−Noise Ratio
Mean Square Error
BPSK
QPSK
8−PSK
Figure 5: Characteristics of 8-PSK signal in an AWGN
channel
Figure 6: Distribution of M SED
2−4
at SNR = 0 dB in an
AWGN channel
Figure 7: Distribution of M SED
4−8
at SNR = 0 dB in an
AWGN channel
Figure 8: Distribution of M SED
2−4
at SNR = 3 dB in
multipath fading channel
AN AUTOMATIC BLIND MODULATION RECOGNITION ALGORITHM FOR M-PSK SIGNALS BASED ON MSE
CRITERION
17
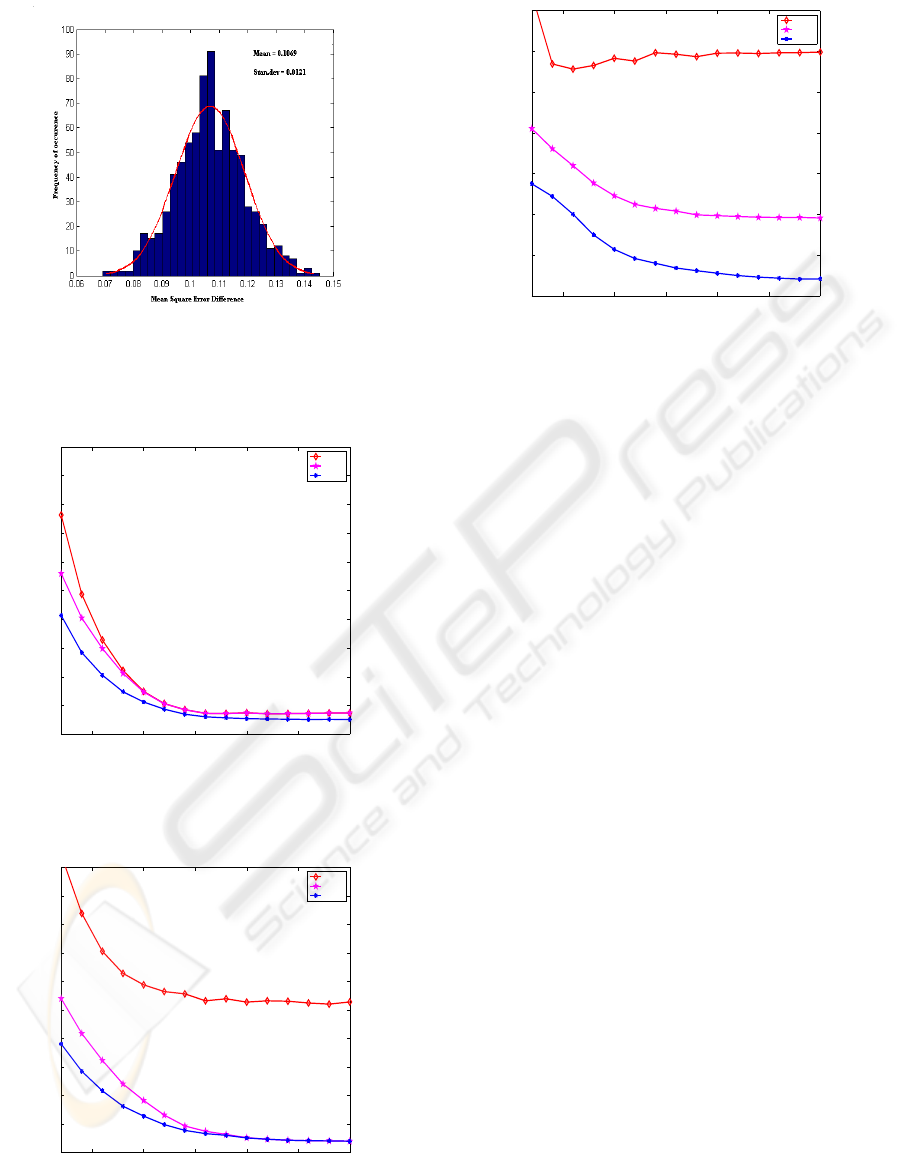
Figure 9: Distribution of M SED
4−8
at SNR = 5 dB in
multipath fading channel
5 10 15 20 25 30
0
0.1
0.2
0.3
0.4
0.5
0.6
0.7
0.8
0.9
1
signal to noise ratio
mean square error
BPSK
QPSK
8PSK
Figure 10: Characteristics of BPSK signal in multipath fad-
ing channel
5 10 15 20 25 30
0
0.1
0.2
0.3
0.4
0.5
0.6
0.7
0.8
0.9
1
signal to noise ratio
mean square error
BPSK
QPSK
8PSK
Figure 11: Characteristics of QPSK signal in multipath fad-
ing channel
5 10 15 20 25 30
0
0.1
0.2
0.3
0.4
0.5
0.6
signal to noise ratio
mean square error
BPSK
QPSK
8PSK
Figure 12: Characteristics of 8-PSK signal in multipath fad-
ing channel
at low SNR in fading channel. Moreover, the number
of samples required by the recognizer for perform-
ing recognition task is much smaller compared to the
earlier reported methods (Wong and Nandi, 2004),
(Azzouz and Nandi, 1996a), (Mobasseri, 1999) and
(Umebayashi et al., 2000).
REFERENCES
Azzouz, E. E. and Nandi, A. K. (1996a). Automatic modu-
lation recognition of communication signals. Kulwer
Academic Publishers, Dordrecht.
Azzouz, E. E. and Nandi, A. K. (1996b). Procedure for au-
tomatic recognition of analog and digital modulations.
In IEE Proceedings on Communication. IEE, UK.
Boiteau, D. and Martret, C. L. (1998). A generalized maxi-
mum likelihood framework for modulation classifica-
tion. In ICASSP’98, IEEE International conference
on Acoustics, Speech, and Signal Processing. IEEE,
USA.
Chen, S. and Chng, E. S. (2004). oncurrent constant modu-
lus algorithm and soft decision directed scheme for
fractionally-spaced blind equalization. In ICC ’04,
IEEE international conference on Communication.
IEEE, USA.
Halmi, M. H. and Abdalla, A. G. E. (2003). Detection of
modulation scheme for software defined radio systems
in 4th generation mobile network. In APCC’03, The
9th Asia-Pacific conference on communications.
Hsue, S. Z. and Soliman, S. S. (1990). Automatic modu-
lation classification using zero crossing. In IEE Pro-
ceedings on Radar and Signal Processing. IEE, UK.
Liedtke, F. F. (1984). Computer simulation of an automatic
classification procedure for digitally modulated com-
munication signals with unknown parameters. In Sig-
nal Processing. Elsevier North-Holland, Inc. Amster-
dam.
ICETE 2005 - WIRELESS COMMUNICATION SYSTEMS AND NETWORKS
18

Mobasseri, B. G. (1999). Constellations shape as a robust
signature for digital modulation recognition. In MIL-
COM ’99, IEEE Military Communication Conference
Proceedings. IEEE, USA.
Mobasseri, B. G. (2000). Digital modulation classification
using constellation shape. In Signal Processing. Else-
vier North-Holland, Inc. Amsterdam.
Proakis, J. G. (2001). Digital Communication. McGraw-
Hill, 4th edition edition.
Soliman, S. S. and Hsue, S. Z. (1992). Signal classifica-
tion using statistical moments. In IEEE Transaction
on Communication. IEEE, USA.
Umebayashi, K. et al. (2000). Blind adaptive estimation
of modulation scheme for software defined radio. In
PIMRC’00, The 11th IEEE International symposium
on Personal, Indoor and Mobile Radio Communica-
tion. IEEE, USA.
Weaver, C. S. et al. (1969). The automatic classification of
modulation types by pattern recognition. In Standford
electronics laboratories Technical report No.1829-2.
Standford electronics laboratories.
Wei, W. and Mendel, J. M. (1999). A fuzzy logic method for
modulation classification in non-idle envoronment. In
IEEE Transaction on Fussy Syatems. IEEE, USA.
Wong, M. L. D. and Nandi, A. K. (2004). Automatic digital
modulation recognition using artificial neural network
and genetic algorithm. In Signal Processing. Elsevier
North-Holland, Inc. Amsterdam.
AN AUTOMATIC BLIND MODULATION RECOGNITION ALGORITHM FOR M-PSK SIGNALS BASED ON MSE
CRITERION
19
