
PERFORMANCE OF VOIP OVER IEEE 802.11G DSSS-OFDM MODE
WITH IEEE 802.11E QOS SUPPORT
Gr
´
ainne Hanley, Se
´
an Murphy, Liam Murphy
Department of Computer Science
University College Dublin, Belfield, Dublin 4
Keywords:
WLAN, IEEE 802.11e, QoS, Voice over IP, Medium Access Control.
Abstract:
This paper examines, via simulation, the performance of an 802.11e MAC over an 802.11g PHY operating in
DSSS-OFDM mode. The DSSS-OFDM scheme provides data rates of up to 54Mb/s as well as interoperabil-
ity with 802.11b nodes. Due to the widespread use of 802.11b nodes, such interoperability is an important
consideration. This paper involves a study of the number of simultaneous bidirectional G.711 VoIP calls that
can be supported by such a WLAN. The results show that this mode of operation introduces a very significant
overhead. The actual number of calls that can be carried is limited to 12 when using the 24Mb/s data rate
and 13 when using either the 36Mb/s or 54Mb/s rates. These results demonstrate the well-known disparity
between uplink and downlink performance, with the downlink imposing the limit on the number of calls that
can be carried by the system in the cases studied. The results also show that when when a significant amount
of lower priority traffic is introduced into the system, it can have a significant impact on VoIP call capacity
despite the use of 802.11e.
1 INTRODUCTION
WLAN support for QoS is one issue that is receiving
considerable interest at present. The IEEE 802.11e
standard, which provides standardised QoS support,
is in the final stages of development. Frustrated by
the sluggish pace of development of the standard, the
Wi-Fi Alliance, an industry forum, is attempting to
promote development of WLAN QoS by offering cer-
tification for a subset of the standard’s functionality
which it calls Wi-Fi Multimedia (WMM). A signifi-
cant number of vendors are already certified.
While vendors are beginning to ship systems with
QoS support, there is still considerable debate within
the community regarding how best to operate these
systems. The standards have been written in such a
way as to offer much flexibility to enable vendors to
differentiate their product offerings. This flexibility,
coupled with the complexity of the system, means that
large differences in system performance are possible.
At present, it is not clearly known how best to config-
ure such systems. Hence, there is a need to understand
how these systems behave for different parameter sets
in different configurations.
One application driving the development of WLAN
QoS support is Voice over IP (VoIP). Many enter-
prises and WLAN operators are very interested in pro-
viding VoIP over WLAN (VoIPoW) and indeed some
vendors have product offerings which can address this
need. However, such product offerings are typically
proprietary. Standardised solutions offer many known
benefits and for this reason, it is important to deter-
mine the performance of VoIPoW in a standardised
802.11e/802.11g setting.
As there are currently a very large number of
802.11b network interfaces in existence, it is inter-
esting to see how backwards compatibility issues af-
fect system performance for 802.11e/802.11g sys-
tems. 802.11g provides two modulation schemes with
backwards compatibility mechanisms. The first is
called ERP-OFDM, while the other is called DSSS-
OFDM. ERP-OFDM is based on transmitting Request
To Send /Clear To Send (RTS/CTS) signalling at a low
rate such that legacy nodes know when the medium
is unavailable. DSSS-OFDM is based on transmit-
ting packet preamble and header information at an
802.11b compliant rate.
Some research has taken place to determine the per-
formance of the ERP-OFDM scheme in certain cir-
cumstances. This paper aims to determine the perfor-
20
Hanley G., Murphy S. and Murphy L. (2005).
PERFORMANCE OF VOIP OVER IEEE 802.11G DSSS-OFDM MODE WITH IEEE 802.11E QOS SUPPORT.
In Proceedings of the Second International Conference on e-Business and Telecommunication Networks, pages 20-27
DOI: 10.5220/0001416200200027
Copyright
c
SciTePress

mance of the latter – the DSSS-OFDM scheme – in a
VoIP context.
This paper is structured as follows. Section II
briefly outlines the operation of the 802.11e MAC and
the 802.11g PHY, and Section III outlines some of the
published work related to this study. In section IV,
the simulation setup is described in detail. This is fol-
lowed by a description of the simulations performed
and a discussion of the results obtained in section V.
The paper is concluded in section VI.
2 IEEE 802.11
The simulations studied here use an 802.11e MAC
layer in association with an 802.11g PHY layer; the
operation of these layers is briefly outlined below.
2.1 IEEE 802.11e
IEEE 802.11e (IEEE, 2005) provides for centralised
and distributed QoS support at the Medium Access
Control(MAC) layer. As there is considerably more
complexity in the centralised scheme, the focus here
is on the distributed approach, the Enhanced Distrib-
uted Channel Access (EDCA).
EDCA provides for 4 different so-called Access
Categories (ACs). Different priorities for the 4 ACs
are realised through 4 coupled Carrier Sense Multiple
Access with Collision Avoidance (CSMA/CA) mech-
anisms. These mechanisms are coupled as they con-
tend for access to the same medium, but they differ in
that they are parameterised differently. More specifi-
cally, the parameters for the higher priority traffic are
chosen to enable it to obtain access to the medium
more quickly than the lower priority traffic. Con-
tention between different priorities in a single station
is resolved such that the higher priority traffic gains
access to the medium, while the lower priority enters
a backoff state.
Two of the key parameters which control how
the different access categories obtain access to the
medium are the Contention Window (CW) sizes and
the Arbitration Inter-Frame Space (AIFS). The for-
mer controls how much random waiting, or backoff,
delay should be introduced for each AC to avoid col-
lision and the latter controls how long each AC waits
after a transmission has terminated before attempting
to access the medium.
The 4 ACs have been labelled Voice (VO), Video
(VI), Best Effort (BE) and Background (BG). Para-
meter settings for each of the categories are shown in
Table 1.
The values of the 802.11g parameters are shown to
be relative to aCWmin and aCWmax. As stipulated
in the standard, an aCWmin of 31 and an aCWmax
Table 1: Default IEEE 802.11e EDCA Parameter Set
AC CWmin CWmax AIFSN
VO (aCWmin+1)/4-
1
(aCWmin+1)/2-
1
2
VI (aCWmin+1)/2-
1
aCWmin 2
BE aCWmin aCWmax 3
BG aCWmin aCWmax 7
of 1023 were used, to maintain compatibility with
802.11b systems carrying VoIP traffic.
2.2 IEEE 802.11g
The 802.11g Physical layer (PHY) (IEEE, 2003)
enhancement outlines 4 modulation schemes. Two
of which are mandatory – ERP-OFDM and ERP-
CCK/DSSS – and two of which are optional – ERP-
PBSS and DSSS-OFDM. Of the four schemes, only
ERP-OFDM and DSSS-OFDM provide data rates
of up to 54Mb/s using OFDM modulation schemes,
while also providing explicit support for interoperat-
ing with 802.11b nodes. Such support is necessary
as 802.11b nodes are not able to detect or understand
OFDM modulated signals.
The ERP-OFDM scheme is a variant of the 802.11a
PHY scheme modified for use in the 2.4 GHz band.
The DSSS-OFDM scheme is a hybrid modulation
scheme that combines a DSSS preamble and header
with an OFDM payload transmission.
ERP-OFDM uses the RTS/CTS mechanism to pro-
vide 802.11b interoperability. This mechanism gives
the 802.11g nodes time to freely transmit at the higher
rates. In the DSSS-OFDM scheme, all packet headers
and preambles are transmitted at the lower 1Mb/s rate
using 802.11b compliant DSSS modulation. Thus,
802.11b nodes know how the medium is being used
even if they cannot detect OFDM payload transmis-
sion.
3 RELATED WORK
While WLAN performance analysis is currently a
very active research area, little has been published on
VoIP performance for 802.11e/802.11g systems.
Although Mangold et al. (Mangold et al.,
2003) analysed the performance of the 802.11e
standard, their study was performed in relation to
802.11e/802.11a. Therefore, backward compatibility
with 802.11b was not a concern.
Choi and Pavon (Choi and Pavon, 2003) dis-
cussed backward compatibility of the 802.11g ERP-
OFDM scheme with regards to the 802.11b stan-
PERFORMANCE OF VOIP OVER IEEE 802.11G DSSS-OFDM MODE WITH IEEE 802.11E QOS SUPPORT
21
dard. Their results showed that the ERP-OFDM
RTS/CTS protection mechanism introduces a lot of
overhead, thus greatly reducing the performance of
the network when compared with a system contain-
ing only 802.11g nodes. Their results showed that
the transmission time of a packet on 802.11g with a
long preamble RTS/CTS exchange, was about dou-
ble that of 802.11g with RTS/CTS disabled. How-
ever, Bianchi (Bianchi, 2000) showed that without
the RTS/CTS mechanism, the performance of the
802.11b DCF scheme was highly dependent on the
number of nodes in the system and the size of the min-
imum CW. Given that the DSSS-OFDM scheme does
not require RTS/CTS signalling, it is interesting to see
the performance levels that can be obtained using this
scheme.
Garg and Kappes (Garg and Kappes, 2003) per-
formed an analytical analysis of VoIP capacity for the
802.11b and 802.11a schemes. They developed a for-
mula which can be used to calculate the VoIP call
capacity of a WLAN network under certain assump-
tions. However, their paper did not discuss the use of
the 802.11e QoS mechanism. In addition, although
quite useful, their formula does not hold, unless there
is only VoIP traffic on the system. Also, their formula
is based on the assumption that there are only ever
two active senders in the network, whereby the AP
and one wireless node always have a packet to send.
For these reasons, it was unclear that their work could
accurately predict the levels of performance that can
be attained by VoIP traffic on an 802.11e/g system.
An important phenomenon in these systems is the
disparity between the system performance in the up-
link and downlink; this has been reported in previ-
ous work by both Grilo and Nunes (Grilo and Nunes,
2002) and Casetti and Chiasserini (Casetti and Chi-
asserini, 2004). Both papers were however related to
the 802.11e MAC layer over the 802.11b PHY layer.
The same difference is apparent throughout the results
in this paper but is further examined and discussed in
relation to the 802.11g PHY scenario.
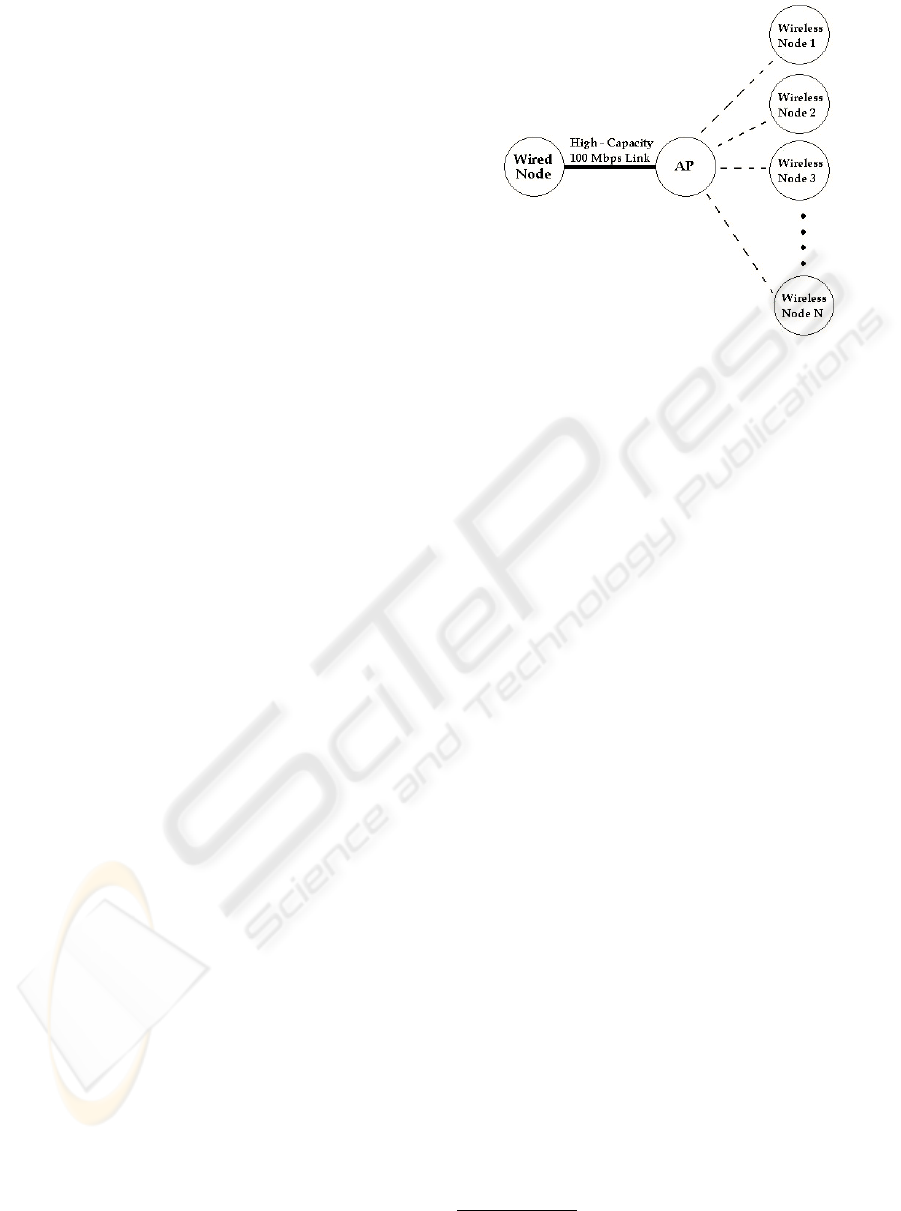
4 THE SIMULATION SCENARIO
In order to determine the performance of VoIP in
an 802.11e/802.11g system, a series of simulations
were performed. In these simulations, the wireless
nodes were arranged with an AP in the network which
formed a connection between every 802.11e node in
the wireless domain and a single node in the wired
domain (see Fig.1). This AP was connected to the
wired network by a high capacity link with negligible
delay, which was dimensioned such that it could eas-
ily carry all the traffic and hence no loss occurred on
this link. All wireless nodes were within radio range
Figure 1: Network Topology
of each other, thus ensuring that no issues arose relat-
ing to hidden/exposed station problems. In addition,
all nodes were situated sufficiently close together so
that they were able to transmit at the highest data rate
supported by 802.11g. Static routing
1
was used, so
as to ensure realistic routing of the wireless traffic.
The simulations were configured such that each
node used bidirectional CBR traffic sources, so as to
model VoIP traffic. This was represented as Constant
Bit-Rate (CBR) traffic, transmitted using User Data-
gram Protocol (UDP). In a similar manner to that of
Yu, Choi and Lee (Yu et al., 2004), these sources were
parameterised to model G.711 voice at 64kb/s with
20ms payload. The G.711 scheme was chosen as it
is still commonly used, due to its simplicity, despite
the availability of schemes with better compression.
As in (Yu et al., 2004) a VoIP data payload size of
160 bytes was generated every 20ms, to which the
20 byte IP header, the 12 byte RTP header and the
8 byte UDP header were added. In order to avoid is-
sues with traffic synchronisation, a low level of ran-
dom noise was introduced into the packet generation
process. This resulted in a source which generated a
200 byte packet approximately every 20ms, resulting
in 80kb/s of traffic in total per node. This VoIP traffic
was always transmitted at the highest priority level of
802.11e in accordance with the standard.
In some of the later experiments, an additional bidi-
rectional low priority, BE traffic source was intro-
duced for each of the bidirectional VoIP sources in
the simulation. Like the VoIP traffic, this was also pa-
rameterised as CBR traffic over UDP but at a rate of
250kb/s and with a 1500 byte data payload. The aim
was to see how a VoIP application would perform if
there was a heavy traffic load at the lower priority.
1
The No Ad-Hoc Routing (NOAH) patch for ns-2.26 was
used - http://icapeople.epfl.ch/widmer/uwb/ns-2/noah.
ICETE 2005 - WIRELESS COMMUNICATION SYSTEMS AND NETWORKS
22
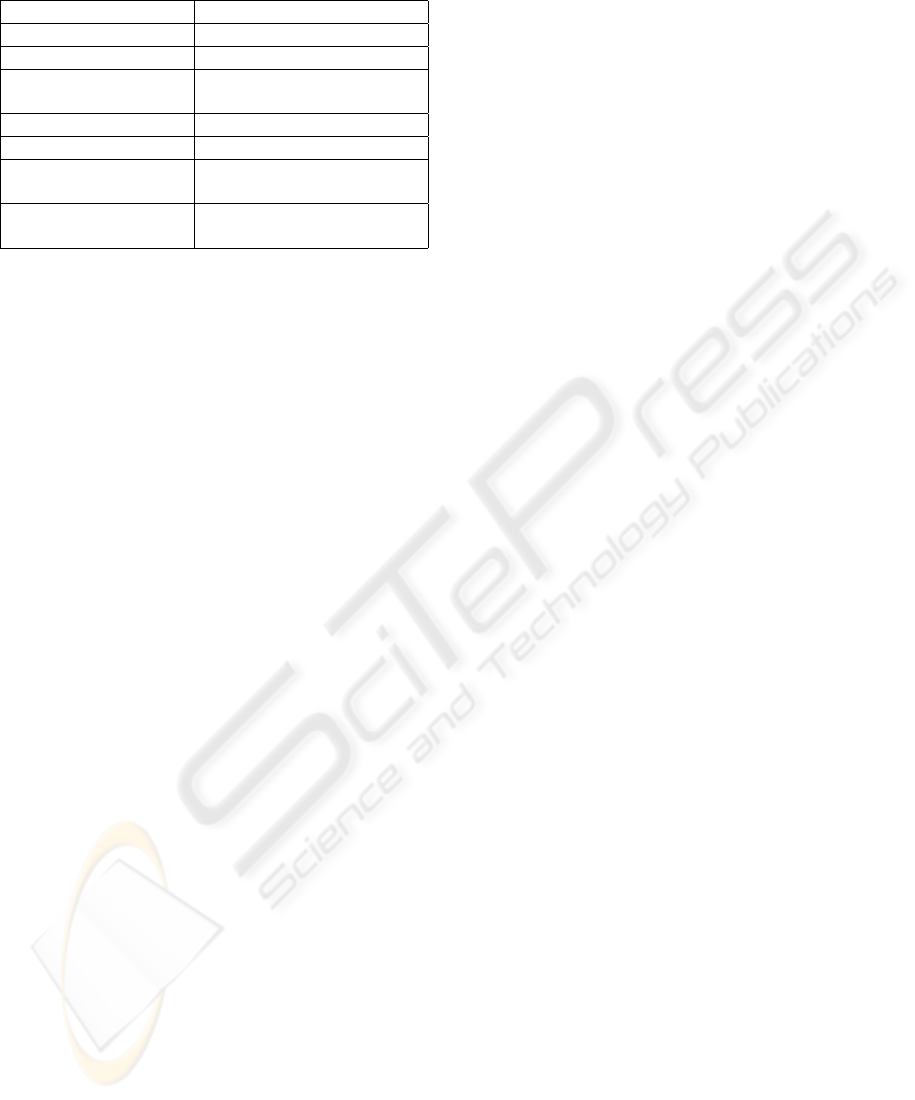
Table 2: Extended Rate IEEE 802.11g PHY Characteristics
Characteristic Value
SlotTime 20µs(long), 9µs(short)
SIFSTime 10µs
CCATime <15µs(long),
<4µs(short)
aCWmin(0) 31
aCWmax 1023
Supported Rates 1, 2, 5.5, 6, 9, 11,12, 18,
24, 36, 48, and 54Mb/s
Mandatory Rates 1, 2, 5.5, 11, 6, 12, and
24Mb/s
The IEEE 802.11g parameters (see Table 2) for
the simulations using the DSSS-OFDM modulation
scheme were chosen to allow backward compatibility
with the IEEE 802.11b PHY. Hence, the long PLCP
preamble, long slot time, and long Clear Channel As-
sessment (CCA) time were used. In accordance with
the standard for DSSS-OFDM, the long PLCP pream-
ble and long PLCP header were transmitted at 1Mb/s.
For this study, a simulation model of the IEEE
802.11e with the EDCA mechanism, developed by
the TKN group in Berlin, for the Network Simulator
package NS was used (Wietholter and Hoene, 2003).
Since the primary focus of this study was the VoIP
traffic, a 50 packet queue limit was chosen for every
node in the system, as there is no advantage in queu-
ing VoIP packets for extended periods because they
are delay limited. Furthermore, studies have indicated
(Yu et al., 2004) that there is a minimal performance
difference between a 50 and 100 packet queue.
Each simulation was run three times and the results
were averaged over these three runs. All simulations
were run for 250 seconds of simulation time, and the
maximum mandatory 802.11g data rate of 24Mb/s as
well as the optional higher 36Mb/s and 54Mb/s rates
were studied.
5 RESULTS
These results are an assessment of the performance of
the DSSS-OFDM scheme with regards to VoIP capac-
ity. This analysis is firstly performed at three differ-
ent data rates but in the absence of any other traffic.
Then the effect of the addition of a large amount of
BE (see Table 1) traffic is examined at the same three
data rates.
In these experiments, loss and delay measurements
were taken at the UDP layer of the protocol stack. The
downlink delays are the average packet delays from
the originating wired node, to the receiving wireless
node. Similarly, the uplink delays are the average
packet delays from the originating wireless node, to
the receiving wired node.
The loss examined here represents packets which
were sent by the UDP transport layer of the transmit-
ting node, but which were never received by the UDP
transport layer of the receiving node. These loss rates
therefore represent the percentage of packets which
are dropped due to collisions on the medium or Inter-
face Queue (IFQ) overflow.
There are MAC level retransmissions of all col-
lided packets, but those packets which exceed the re-
transmission threshold without being successfully re-
ceived are considered as lost. For these simulations,
the Short Retry Limit was set to 7 in accordance with
what is recommended by 802.11e.
VoIP requires certain quality levels: ETSI studies
(ETSI, 2002) indicate that a packet loss rate of 5% is
at the upper bound for acceptable voice quality. Also,
for this study, WLAN delays of greater than 50ms
were considered to be unacceptably high.
5.1 Analysis of VoIP Traffic in an
802.11e/802.11g Network with
DSSS-OFDM Modulation
This set of simulations was performed using the
DSSS-OFDM parameters, and in the absence of any
traffic other than the VoIP traffic being analysed. The
simulations were run at the maximum mandatory data
rate of 24Mb/s, as well as at the optional higher rates
of 36Mb/s and 54Mb/s. The results show a compar-
ison of the uplink and downlink results for the end
to end delays and loss rates, the average contention
window sizes used for the backoff calculation and the
percentage occupancy of the IFQ.
5.1.1 End-to-End Delay and Loss Rates
At first, the similarity in the results for each of the
three data rates, 24, 36 and 54Mb/s, seems surprising.
In fact, results show that increasing the rate at which
the actual data is sent has quite a small impact on
overall performance levels. This can be attributed to
the fact that in the DSSS-OFDM scheme, the longer
PLCP data is used and is sent at a slow 1Mb/s rate for
backwards compatibility. Therefore a large overhead
is introduced for each packet transmission. The neg-
ative performance effects of this large overhead dom-
inate the overall system performance and to a great
degree mask the positive impact of an increased data
rate.
Results show that increasing the maximum data
rate of the system from 24Mb/s, to 36Mb/s, and then
to 54Mb/s, does lower the delay experienced by pack-
ets (see Fig.2). However, if the average delay for 15
bidirectional VoIP calls is examined for each of the
PERFORMANCE OF VOIP OVER IEEE 802.11G DSSS-OFDM MODE WITH IEEE 802.11E QOS SUPPORT
23
three data rates, the average downlink end-to-end de-
lay at 24Mb/s is 111ms, at 36Mb/s is 96ms, and at
54Mb/s is 86ms. Although notable, these improve-
ments in delay at the higher data rates are quite low
given the greatly increased data rates.
The known disparity between uplink and downlink
performance is quite visible in these results: the delay
difference between uplink and downlink is especially
apparent when there are 13, 14 and 15 calls on the
network. For this region there are quite large down-
link delays in comparison to minimal uplink delays.
This can be attributed to the saturation of the down-
link occurring prior to that of the uplink. However, it
can be seen that after 15 calls the uplink delays also
begin to climb. By the 17 call point, there is more uni-
formity to the delays as both uplink and downlink are
saturated and hence delay levels begin to converge.
It is clear from the results that in the 24Mb/s sce-
nario a large increase in loss is experienced by the
downlink when there are only 13 bidirectional calls on
the system. In fact, at this stage loss rates are already
in excess of the 5% threshold (see Fig.3). Results
show that the 24Mb/s network can support only 12
bidirectional calls, and both the 36Mb/s and 54Mb/s
systems can support only 13 bidirectional calls before
loss rates on the downlink reach 6% or higher.
In this scenario, the majority of the downlink loss
was due to queue overflow, whereas the majority of
the uplink loss was caused by retransmission failure.
Loss at the AP can be explained by noting that the
AP has to handle downlink traffic for all of the wire-
less nodes; if the medium is congested, then it may
not obtain sufficient access to the medium for all this
downlink traffic, its queue builds up and it suffers
packet loss. In contrast, the individual wireless sta-
tions have much lower traffic levels and so the queues
at the wireless stations rarely contain many packets.
Hence, wireless stations do not encounter IFQ over-
flow. However, it seems that the uplink does experi-
ence a higher probability of collision than the down-
link. These higher levels of collisions and retransmis-
sions on the uplink occasionally lead to a packet be-
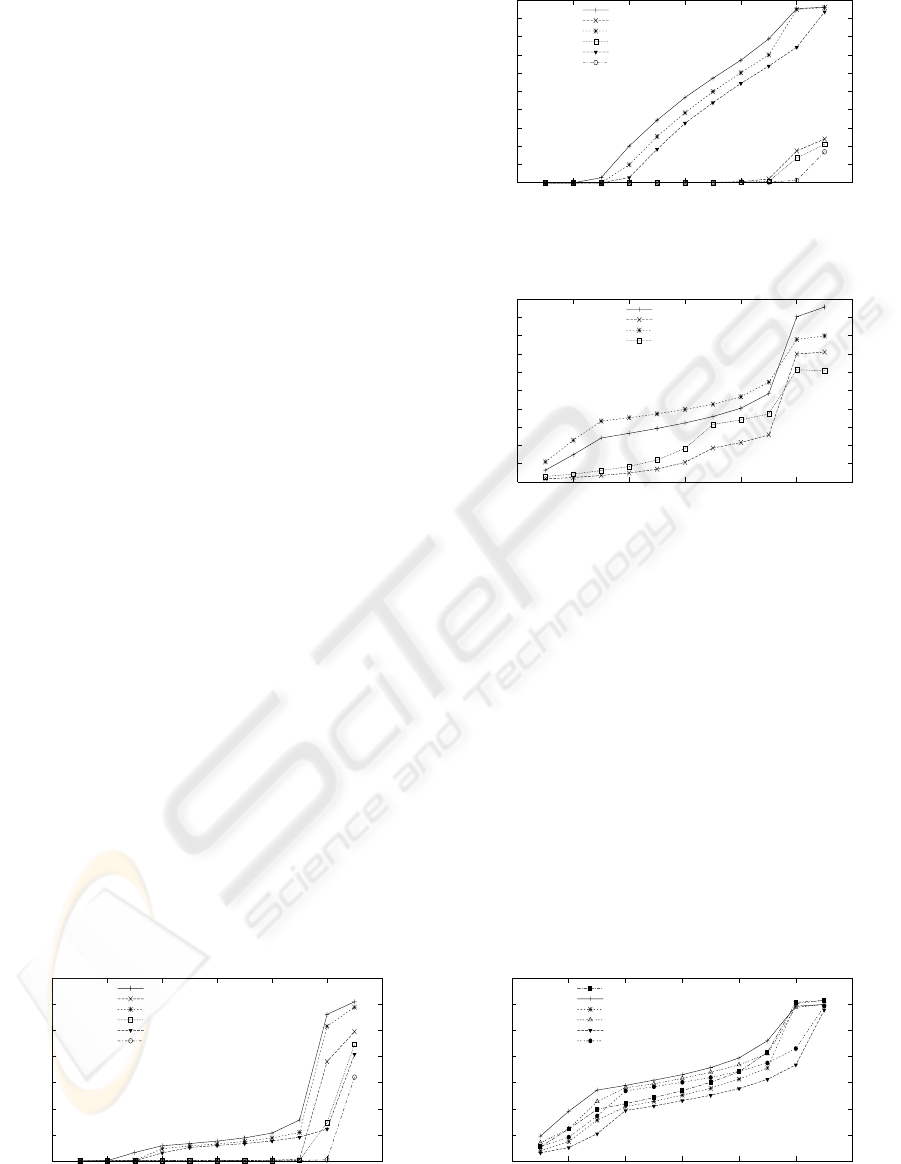
0
200
400
600
800
1000
1200
1400
6 8 10 12 14 16 18
Delay [ms]
Bidirectional VoIP Calls
24 Mbps DL
24 Mbps UL
36 Mbps DL
36 Mbps UL
54 Mbps DL
54 Mbps UL
Figure 2: End-to-End Delays With Only VoIP Traffic
0
10
20
30
40
50
60
70
80
90
100
6 8 10 12 14 16 18
% Loss
Bidirectional VoIP Calls
24 Mbps DL
24 Mbps UL
36 Mbps DL
36 Mbps UL
54 Mbps DL
54 Mbps UL
Figure 3: Loss Rates With Only VoIP Traffic
ing dropped as it has exceeded its maximum number
of retransmission attempts without being successfully
received.
These results indicate that the use of parameters
which enable backward compatibility lead to a serious
reduction in the performance of VoIP applications.
In previous experiments that were performed which
focussed on the ERP-OFDM scheme without back-
ward compatibility mechanisms, it was found that
at 24Mb/s an ERP-OFDM 802.11g WLAN system
could support approximately 48 bidirectional G.711
VoIP calls. In fact, in this scenario, the 802.11g
DSSS-OFDM modulation scheme performs little bet-
ter than a basic 802.11b in terms of VoIP call capac-
ity: Garg and Kappes (Garg and Kappes, 2003) have
shown that the 20ms G.711 capacity for an 11Mb/s
802.11b system is 12 calls.
5.1.2 Contention Window Size
For each of these simulations the Contention Window
(CW) size that was used for any transmission or re-
transmission was recorded. The following graphs (see
Fig.4) show the average size of the high priority CW
for the scenarios which involved between 7 and 17
bidirectional VoIP calls. Surprisingly, it was noted
that the average size of CW used by the AP was al-
ways smaller than that of the corresponding wireless
node.
This difference is as a result of the frequency with
which the AP attempts to access the medium as op-
posed to the frequency with which the wireless nodes
attempt to gain access.
Due to the greater level of traffic at the AP, its IFQ
fills much more quickly than that at any individual
wireless node. This means that frequently when the
AP is attempting to gain access it is not in direct con-
tention with any of the wireless nodes. Due to this
lower contention level, the AP has a lower probabil-
ity of colliding with another packet and thus a lower
probability of having to retransmit with an increased
CW.
On the other hand, the wireless node will almost
ICETE 2005 - WIRELESS COMMUNICATION SYSTEMS AND NETWORKS
24
always be in direct contention with the AP when it
is attempting to transmit, hence, it will have a higher
potential for colliding with a packet sent by the AP.
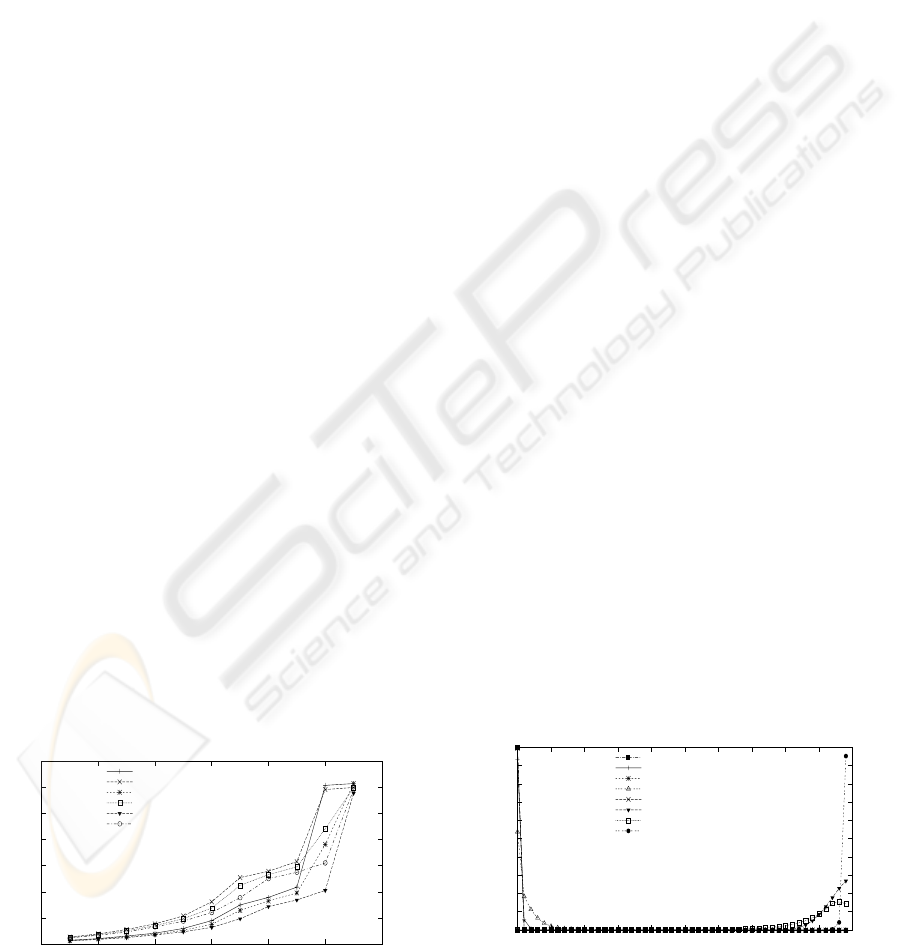
5.1.3 IFQ Occupancy
The results show a breakdown of the IFQ occupancy
for high priority traffic as a percentage of the simula-
tion time. These statistics are very informative as to
the point at which high priority traffic begins to en-
counter notable delays in accessing the medium (see
Fig.5). If queue occupancy is at a high level for a
large amount of the simulation time, it is an indica-
tion that there is a lot of congestion on the network,
and hence packets are encountering difficulty in ac-
cessing the medium.
The results from the 24Mb/s simulations (see Fig.5
show that the queue occupancy rates of the wireless
nodes are lower than that of the AP. This behaviour is
not unexpected as the amount of traffic that a single
wireless node has to handle is a lot lower than the
traffic levels at the AP.
5.2 Analysis of VoIP Traffic in the
presence of Best Effort traffic
This section describes experiments that were per-
formed to determine the impact of high levels of Best
Effort CBR traffic on the system, while using DSSS-
OFDM modulation.
5.2.1 End-to-End Delay and Loss Rates
If the end-to-end delays for these bidirectional VoIP
calls are compared with the results obtained in the ab-
sence of BE traffic (see Fig.2 and 6), a significant
increase in delay is observed. In addition, for this
network setup, results show a definite increase in the
losses at all three data rates, compared to the voice
only traffic scenario (see Fig.3 and 7). It was found
that in the absence of BE traffic, the 24Mb/s network
could support 12 bidirectional calls, and that both the
7
8
9
10
11
12
13
14
6 8 10 12 14 16 18
Average CW Size
Bidirectional VoIP Calls
24 Mbps DL
24 Mbps UL
36 Mbps DL
36 Mbps UL
54 Mbps DL
54 Mbps UL
Figure 4: Contention Window Sizes With Only VoIP Traffic
36Mb/s and the 54Mb/s networks could support 13
bidirectional calls before delays and loss rates on the
downlink reach unacceptable levels.
Based on the loss and delay results in the pres-
ence of BE traffic, it can be seen that the 24Mb/s net-
work can support only 9 bidirectional calls, and both
the 36Mb/s and 54Mb/s systems can support only 10
bidirectional calls. After this point, loss rates on the
downlink become excessive and the VoIP traffic en-
counters a large increase in end-to-end delay. This
indicates that with this amount of additional traffic
in this network scenario, the number of supportable
bidirectional VoIP calls is reduced by 3, which is a
significant decrease in terms of VoIP call capacity.
Due to the nature of the 802.11e mechanism such a
large increase in delay seems somewhat surprising as
802.11e was designed to facilitate medium access to
higher priority traffic largely at the expense of lower
priority traffic. However, here it is demonstrated that
this is not always the case.
The influence of background traffic is dependent
upon many factors. In general, extra traffic will in-
crease the risk of collision, which will lead to an in-
creased number of retransmissions as well as a greater
number of lost packets.
In this case, the lower priority, BE traffic packets
have a data payload of 1500 bytes as opposed to the
160 bytes in the VoIP packets, and hence will occupy
the medium for longer periods. Such longer trans-
mission times will further increase the risk of colli-
sion with VoIP traffic. In fact, the transmission of a
BE packet at the 24Mb/s data rate will occupy the
medium for approximately 1ms as opposed to only
590µs for a VoIP packet. Therefore, during this ad-
ditional 410µs delay more VoIP packets will have ar-
rived in the AP queue. This will cause the queue at
the AP to build much more quickly than when no BE
traffic is present. This will lead to increased queu-
ing delays, as well as an increase in back-off delays,
for the VoIP traffic. Plus, as queue occupancy lev-
els increase, it could eventually lead to packets being
dropped due to queue overflow.
0
10
20
30
40
50
60
70
80
90
100
0 5 10 15 20 25 30 35 40 45 50
% Simulation Time
Size of IFQ
8 UL VoIP calls
8 DL VoIP calls
12 ULVoIP calls
12 DL VoIP calls
14 UL VoIP calls
14 DLVoIP calls
17 UL VoIP calls
17 DL VoIP calls
Figure 5: 24Mb/s AP and Wireless Node IFQ Sizes With
Only VoIP Traffic
PERFORMANCE OF VOIP OVER IEEE 802.11G DSSS-OFDM MODE WITH IEEE 802.11E QOS SUPPORT
25
5.2.2 Packets Received After Retransmission
In order to further understand the increases in loss and
delay, the levels of packets received after retransmis-
sion was examined.
In this scenario, results show that the additional BE
traffic leads to a large increase in retransmissions at
both the AP and at the wireless nodes. This can be
clearly seen in Fig.8.
The medium capacity used when packets collide
and are retransmitted is a highly inefficient use of
resources. This inefficient use of resources leads to
less available resources in the system, which results
in lower system throughput and lower service rates on
each queue in the system. This, in turn, causes queue
occupancy to increase.
Due to the high traffic levels at the AP, an increase
in retransmission levels has a large impact on the
downlink delay in particular. Combined with its high
packet arrival rate this can often also lead to queue
overflow at the AP, which results in increased loss lev-
els on the downlink.
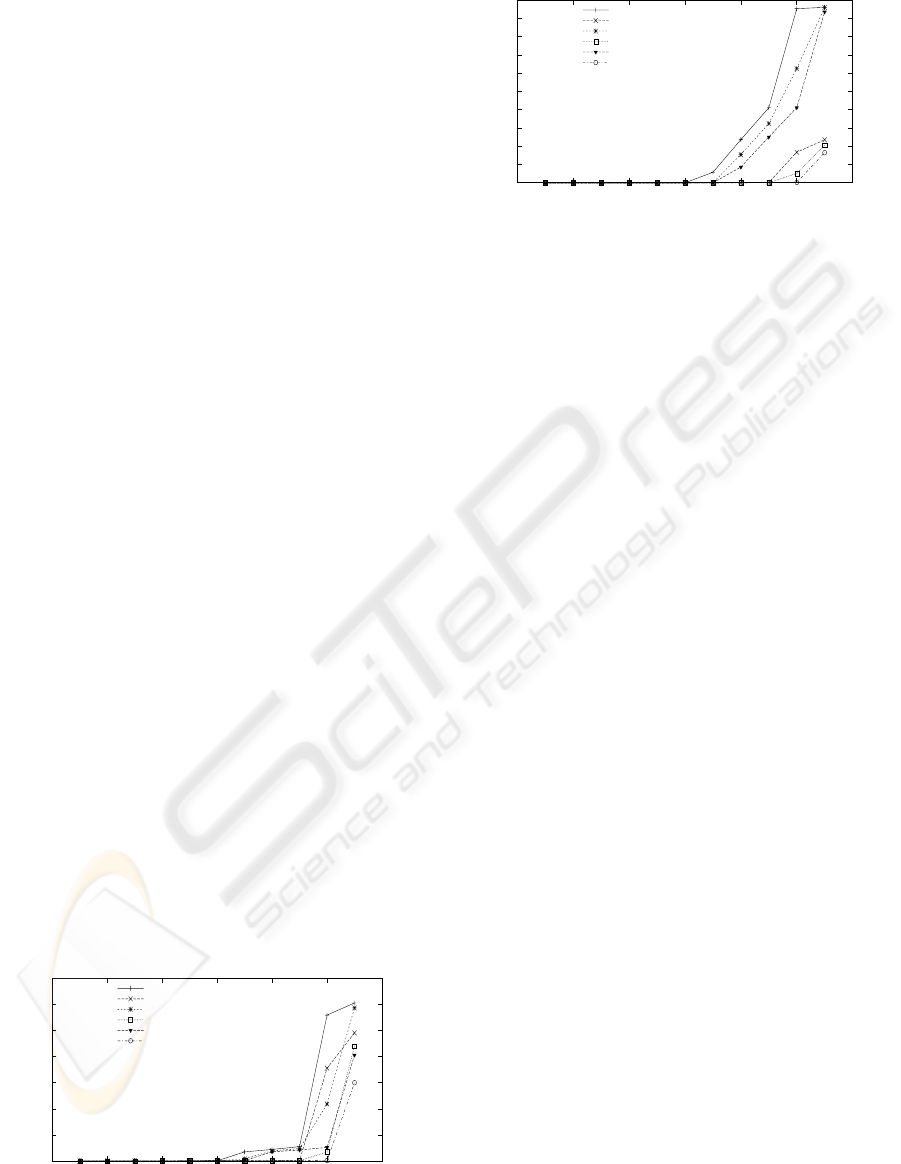
5.2.3 Average Contention Window Sizes
The results again show that the AP has a consistently
lower CW than the wireless nodes (see Fig.9). How-
ever, the results can be seen to show three phases in
the relationship between the contention window sizes
of the AP and the individual wireless nodes. Firstly,
from 7 to 10 VoIP calls, then from the 10 to 15 VoIP
calls and finally as the level of voice traffic reaches 16
to 17 VoIP calls, a third distinct region can be seen.
If these results are considered in association with
the IFQ occupancy rates then an association between
both sets of results can be seen. In the first phase,
both the AP and wireless nodes have an empty IFQ
for the majority of the time, that is, at least more than
50% of the time the queues are empty. However in the
second phase, it can be noted from the results that the
AP IFQ has reached a point whereby the IFQ contains
packets for most of the simulation time. Although at
0
200
400
600
800
1000
1200
1400
6 8 10 12 14 16 18
Delay [ms]
Bidirectional VoIP Calls
24 Mbps DL
24 Mbps UL
36 Mbps DL
36 Mbps UL
54 Mbps DL
54 Mbps UL
Figure 6: End-to-End Delays With Best Effort Traffic
0
10
20
30
40
50
60
70
80
90
100
6 8 10 12 14 16 18
% Loss
Bidirectional VoIP Calls
24 Mbps DL
24 Mbps UL
36 Mbps DL
36 Mbps UL
54 Mbps DL
54 Mbps UL
Figure 7: Loss Rates With Best Effort Traffic
0
10
20
30
40
50
60
70
80
90
100
6 8 10 12 14 16 18
% Packets Retransmitted
Bidirectional VoIP Calls
DL (BE Traffic)
DL (no BE Traffic)
UL (BE Traffic)
UL (no BE Traffic)
Figure 8: VoIP Packets Received After Retransmission
With Best Effort Traffic at 24Mb/s
this stage the wireless node queues still remain empty
for most of the time. The final section corresponds to
a stage when both the AP and wireless nodes queues
are full for the majority of the simulation time and the
CW size can be seen to increase more rapidly until
the CW size of the uplink and downlink ultimately
converge.
The difference in the uplink and downlink CW
sizes is a reflection of the differing levels of retrans-
missions on the uplink and downlink since retrans-
missions are sent with an increased CW; as the uplink
has more retransmissions, its CW is higher. Also, in
this scenario, there is correlation between the IFQ oc-
cupancy and the mean CW size. As the mean CW size
7
8
9
10
11
12
13
14
6 8 10 12 14 16 18
Average CW Size
Bidirectional VoIP Calls
24 Mbps DL
24 Mbps UL
36 Mbps DL
36 Mbps UL
54 Mbps DL
54 Mbps UL
Figure 9: Contention Window Sizes With Best Effort Traffic
ICETE 2005 - WIRELESS COMMUNICATION SYSTEMS AND NETWORKS
26

increases (due to retransmissions on the medium),
there are increased delays and lower medium through-
put resulting in increasing occupancy levels at the
IFQ.
6 CONCLUSION
The VoIP capacity of the DSSS-OFDM modulation
scheme when using parameters which provided back-
ward compatibility, showed that the 24Mb/s network
can support only 12 bidirectional calls, and both the
36Mb/s and 54Mb/s systems can support only 13 bidi-
rectional calls. Above these capacities, loss rates on
the downlink reach an unacceptably high level. The
results also clearly show that, as expected, the down-
link quality begins to suffer long before the perfor-
mance of the uplink begins to deteriorate.
Interestingly, the average size of CW used by the
AP was generally smaller than that of the wireless
nodes. This was due to the different medium access
requirements of the AP and the individual wireless
nodes. The AP almost always had a packet waiting
in its IFQ for transmission and so due to the lower
levels of traffic being sent by each wireless node of-
ten it was not in direct contention with another node.
In contrast, the wireless nodes were frequently in di-
rect contention with the AP, hence the wireless nodes
often had a higher probability of collision. Since col-
lided packets are retransmitted with an increased CW
size, this led to a difference between the average CW
size at the AP and at the wireless nodes.
Surprisingly, results also showed that the addition
of BE traffic leads to an increase in end-to-end delay,
loss rates and IFQ occupancy for the VoIP traffic. Ad-
ditional traffic leads to an increased risk of collision
for the VoIP packet, which was further increased by
the large size of the BE load. It was found that the
delays resulting from the additional collisions and re-
transmissions cause a large increase in queuing delay
and so decreased the packet service rate, particularly
at the AP.
In fact, it was found that, under such conditions,
the 24Mb/s network can support only 9 bidirectional
calls, and both the 36 and 54Mb/s systems can sup-
port only 10 bidirectional calls before loss rates on
the downlink are in excess of 10%. These unantic-
ipated results indicate that for this network scenario
and with this amount of additional traffic, the number
of supportable bidirectional VoIP calls is reduced by
3 calls.
Future work involves further investigation of back-
ward compatibility mechanisms for 802.11g, further
investigation into ways to equalise the division of
resources between the uplink and the downlink and
investigating the optimum transmission opportunity
sizes for this scenario.
ACKNOWLEDGEMENTS
The support of the Informatics Research initiative of
Enterprise Ireland is gratefully acknowledged.
REFERENCES
Bianchi, G. (2000). “Performance Analysis Of The
IEEE 802.11 Distributed Coordination Function”.
IEEE Journal on Selected Areas in Communications,
18(3):535–547.
Casetti, C. and Chiasserini, C. F. (2004). “Improving Fair-
ness And Throughput For Voice Traffic in 802.11e
EDCA”. In Proc. IEEE PIMRC, Barcelona, Spain.
Choi, S. and Pavon, J. P. (2003). “802.11g CP: A Solution
For IEEE 802.11g And 802.11b Inter-Working”. In
Proc. IEEE VTC, Jeju, Korea.
ETSI (2002). “ETSI TR 101 329-6 V2.1.1, TIPHON Re-
lease 3; End-to-End Quality of Service in TIPHON
Systems; Part 6”.
Garg, S. and Kappes, M. (2003). “Can I Add a VoIP Call?”.
In Proc. IEEE ICC, Anchorage, Alaska, USA.
Grilo, A. and Nunes, M. (2002). “Performance Evaluation
of IEEE 802.11e”. In Proc. IEEE PIMRC, Coimbra,
Portugal.
IEEE (2003). “Wireless LAN Medium Access Control and
Physical Layer Specifications Amendment 4: Further
Higher Data Rate Extension in the 2.4 GHz Band,
IEEE Std 802.11g-2003”.
IEEE (2005). “Local and Metropolitan Area Networks -
Specific Requirements Part 11: Wireless LAN Medium
Access Control and Physical Layer specifications:
Amendment: Medium Access Control (MAC) Quality
of Service Enhancements - P802.11e/D13.0”.
Mangold, S., Choi, S., Hiertz, G., Klein, O., and Walke, B.
(2003). “Analysis of IEEE 802.11e for QoS Support
in Wireless LANs”. IEEE Wireless Communications,
10(6):40–50.
Wietholter, S. and Hoene, C. (2003). “Design And Verifi-
cation of an IEEE 802.11e EDCF Simulation Model
in ns-2.26: TKN-03-019”. Technical report, TKN,
Berlin.
Yu, J., Choi, S., and Lee, J. (2004). “Enhancement of VoIP
Over IEEE 802.11 WLAN Via Dual Queue Strategy”.
In Proc. IEEE ICC, Paris, France.
PERFORMANCE OF VOIP OVER IEEE 802.11G DSSS-OFDM MODE WITH IEEE 802.11E QOS SUPPORT
27
