
ESTIMATION OF THE DISTRIBUTIONS OF THE QOS
PARAMETERS USING SAMPLED PASSIVE MEASUREMENTS
TECHNIQUES
Yazeed A. Al-Sbou
a,b
Reza Saatchi
a
Samir Al-Khayatt
a
Rebecca Strachan
a
a
Sheffield Hallam University, Faculty of Art, Computing, Engineering and Science, City campus, Howard Street,
Sheffield, S1 1WB, UK
Keywords: Quality of Service (QoS), network measurements, traffic-sampling methods, network performance analysis.
Abstract: As networks grow in complexity and scale, the importance of network performance monitoring and
measurement also increases significantly. High data rates often lead to large amount of measurement results.
Therefore, in order to prevent an exhaustion of the network resources and to reduce the measurement cost, a
reduction of the collected data is required. A performance measurement method for estimating the actual
network performance, experienced by the user, has been proposed. This study focuses on monitoring the
network performance and estimates its main Quality of Service (QoS) parameters (delay, throughput, and
jitter) through the use of a non-intrusive passive measurement method based on sampling methodologies.
This method will overcome the drawbacks of both active and passive monitoring methods. That is because it
measures the actual performance experienced by the user and requires reduced calculations of QoS
parameters from the sampled packets. The validation of this approach was analysed and verified through
simulations. Three different sampling techniques (systematic, random, and stratified) were investigated. The
study indicated that an accurate estimation of the QoS parameters could be obtained without the need to
measure across the whole packets of traffic information. As a result, the scheme has shown an estimation of
the detailed characteristics of performance for each user. For a bottleneck based network topology and
traffic conditions used, the random sampling showed the best overall performance.
1 INTRODUCTION
Quality of Service (QoS) network measurement and
analysis have long been of interest to the networking
research community. The analysis of network QoS is
based on measuring the network dynamic
parameters to provide some insight into the way the
user traffic is treated within the network. Monitoring
and measurement schemes usually fall into two
categories: passive and active methods. A passive
measurement is based on achieving measurement of
the actual traffic load in the network. This category
often needs the storage and processing of very large
amount of data. An active measurement, on the other
hand, is based on generating (probing) a new traffic
to be used to get the measurements statistics. In this
case, the QoS and performance of the probe-packet
stream, which is sent periodically, is monitored to
determine (infer) the QoS and the performance of
the user's packets and the network directly. Many
active monitoring tools have been developed to
monitor the network performance (CAIDA, 2005).
When using an active method, the probe packets
will perturb the network. In addition to that,
sometimes the measurements of the probing packets
do not represent the actual user measurements (Aida
et al., 2002). Passive measurements have the
advantage of not adding an extra load to the
network. However, they require the transfer of the
captured data for comparison with the other data and
the identification of each packet by its header or
content, which is hard when the data volume is huge.
Therefore, passive measurements have the
disadvantage of requiring substantial resources for
comparison and computation (Ishibashi et al., 2004).
A combination of both active and passive
methods could be employed for performance
measurement. A performance measurement method,
Change-of-Measure based Passive/Active
Monitoring (CoMPACT Monitor), was used for
324
A. Al-Sbou Y., Saatchi R., Al-Khayatta S. and Strachan R. (2005).
ESTIMATION OF THE DISTRIBUTIONS OF THE QOS PARAMETERS USING SAMPLED PASSIVE MEASUREMENTS TECHNIQUES.
In Proceedings of the Second International Conference on e-Business and Telecommunication Networks, pages 324-329
DOI: 10.5220/0001410503240329
Copyright
c
SciTePress

estimating the actual network performance
experienced by users (Aida et al., 2002 and Ishibashi
et al., 2004).
In order to overcome some of the disadvantages
of both active and passive schemes, sampling
methodologies can be employed. Using these
methodologies for the passive method will reduce
the amount of data to be processed, reduce the
demand on the overhead processing time of the
collected data, and hence speed up the performance
measurement results. In addition, there is no need
for artificial traffic to be injected which will perturb
the network and bias the measurements as in the
active method.
Sometimes, the estimation of the network or user
performance may be difficult to be obtained from
direct measurements of the whole traffic. In this
paper, a scalable and efficient measurement
approach has been used to estimate the network
performance experienced by users and it has been
used to estimate the dynamic QoS parameters
(delay, throughout and jitter). The approach is based
on a combination of a sampling technique and
passive monitoring method. It can estimate not only
the actual performance of individual users and
applications but also the mixed performance
experienced by these users. The estimation of mixed
users performance will be one of the issues raised in
future work of this study.
This rest of this paper is organised as follows:
Section 2 details the theory behind the sampling
techniques. Section 3 details the mathematical model
of the proposed approach. Section 4 presents the
measurement approach used to validate the proposed
approach. Section 5 illustrates the experimental
results produced. Section 6 is the conclusion.
2 SAMPLING TECHNIQUES
The use of sampling techniques provides
information about a specific characteristic of the
traffic. Sampling methods can be characterised by
the sampling algorithm used, the trigger type (i.e.
count-based or time-based trigger) for starting a
sampling interval and the length of the sampling
interval (Zseby, 2002):
1- Sampling algorithm: this describes the basic
procedure for the process of samples selection.
There are three basic processes: systematic
sampling, random sampling, and stratified sampling.
a) Systematic sampling: It describes the
procedure of selecting the starting point and
the frequency of the sampling according to a
pre-determined function. This includes for
example the periodic selection of every n
th
element of a trace. Figure 1 shows the
schematic of the systematic sampling
(Claffy et al., 1993).
Figure 1: Schematic of systematic sampling.
b) Stratified sampling: This method splits the
sampling process into multi-steps. First, the
elements (packets) of the parent population
are grouped into subsets in accordance to a
given characteristics. Then samples are
randomly taken from each subset. Figure 2
illustrates the schematic of the stratified
sampling [5]. For example, if the whole
region of interest, A, is spilt into M disjoint
sub-regions (i.e. buckets) such that
(
Bohdanowicz and Weber, 2005):
regionsubktheisAwhere
jlforAAwithAA
th
k
lj
M
k
k
−
≠=∩=
=
0
1
∪
Figure 2: Schematic of stratified sampling
c) Random sampling: Random sampling
selects the starting points of the sampling
interval in accordance to a random process
[4]. The selections of sampled elements are
independent and each element has an equal
probability of being selected. Figure 3
depicts the schematic of the random
sampling (Claffy et al., 1993).
Figure 3: Schematic of random sampling
2- Sampling frequency and interval length:
Sampling techniques can be differentiated by the
event that triggers the sampling process (Zseby,
2002, Claffy et al., 1993 and
Bohdanowicz and Weber,
2005). The trigger determines what kind of event
starts and stops the sampling intervals. With this, the
sampling frequency and the length of the sampling
interval (measured in packets arrived or elapsed
time) are determined.
3 THE ESTIMATION CONCEPT
This method was used in (Aida et al., 2002 and
Ishibashi et al., 2004) to estimate the actual delay
experienced by a network user and by mixed
applications based on active measurement using a
change-of-measure framework. By change-of-
measure framework, the authors meant a framework
in which the measure of network performance for
(1)
ESTIMATION OF THE DISTRIBUTIONS OF THE QOS PARAMETERS USING SAMPLED PASSIVE
MEASUREMENTS TECHNIQUES
325

probe packets can be converted to a measure for user
packets. In this paper, the concept of this method
will be used to estimate QoS parameters but based
on a combination of passive measurement and
sampling techniques. The mathematical approach
will be modified to include the sampling technique.
Suppose a network under consideration is shared
by K users and let X
k
(n) denotes the measurement
objective of the nth packet of user k. X has the
distribution function of P. The distribution of X may
be written as:
{}
{}
[]
aXP
ax
E
xdPaX
>
>
=
=>
∫
1
)(1)Pr(
where (a) is an arbitrary real number, E[.] is the
expected value and 1
{.}
denotes the indicator
function:
{}
⎩
⎨
⎧
>
=
〉
otherwise
axif
ax
0
1
1
If there are n packets arrived in a measurement
period, X(i) denotes the i
th
value of X. Then the
estimator Z
X
(n,a) of the distribution of X, which is
like the mean estimator, is given by:
()
(){}
∑
=
>
=
n
i
aiXX
n
anZ
1
1
1
,
Suppose a situation in which it is difficult to
measure the user traffic directly and an estimate of
its distribution cannot be obtained. Let V(t) be the
network performance at time t such that if the i-th
arrival packet occurs at t
i
; then V(t
i
) = X(t
i
). Also, let
Y be the sampled version of V(t), and let the
distribution function of Y be Q. Thus, Y is
considered the network performance as measured by
sampled packets and the distribution of Y to estimate
the distribution of X. The distribution of X can be
rewritten by using a change of measure based on the
distribution of Y as follows:
{}
()
()
{}
()
()
()
{}
()
()
⎥
⎦
⎤
⎢
⎣
⎡
=≅>
>≅=>
>>
>
∫
∫
YdQ
YdP
EydQ
ydQ
ydP
aX
thenaXydPaY
aYQay
aY
11Pr
;;Pr)(1)Pr(
Now, suppose n user- packets are sent and Y
packets are measured (sampled) m times. Let Y(j) be
the j-th measurement sample at s
j
such that Y(j) =
V(s
j
), j=1,2,3...m. Then an estimator Z(m,a) of
Pr(X>a) can be derived by using Y(j) as follows:
()
{}
()
()
{}
()
()
()
()
(){}
()
()
()()
()()
jYdQ
jYdP
jLwhere
jL
m
amZ
SoamZ
YdQ
YdP
mYdQ
YdP
EaX
m
i
ajYY
Y
m
j
aYaYQ
=
=
==
⎥
⎦
⎤
⎢
⎣
⎡
≅>
∑
∑
=
>
=
>>
;
1
1
,
;,,1
1
1Pr
1
1
L(j) is the ratio between the probabilities of X and Y.
It is called the likelihood ratio, which can be
obtained through passive measurement, in which
simply it is the count of the number of user packets
arriving between the consecutive sampled packets.
Let ρ
X
(t,δ) be traffic volume (i.e. the number of user
packets) arriving in an interval [t, t+ δ(t)] and let
ρ
Y
(t,δ) be the number of measurements (i.e. the
number of sampled packets) in the interval [t, t+
δ(t)]. This indicates that one measurement (sample)
of Y in that interval can be interpreted as
ρ
X
(t,δ)/ρ
Y
(t,δ). So, L can be rewritten as the ratio
between the distributions of the user packets
received at a given period to the distribution of the
sampled packets in that period:
()
(
)
()
()
()
∑
∑
=
=
=
m
j
jY
jY
m
j
jX
jX
s
s
s
s
jL
1
1
,
,
,
,
,
δρ
δρ
δρ
δρ
δ
Both ρ
X
and ρ
Y
are the number of packets at the
given period. Thus the likelihood ratio can be
obtained by passive measurement. Therefore, the
distribution of X is estimated as:
() ()
()
()
()
()
(){}
()
()
∑
∑∑
=
>
==
=
δρ
δρ
=δ
==
m
1j
jY
jX
ajYY
Y
jY
jX
m
1j
jY
m
1j
jX
,δsρ
,δsρ
1
n
1
m,aZ
Z
m
s
n
s
jL
msρandnsρ
bewill)6(inthissubsituteand
,
,
,
);7(fromthenbecause
4 MEASUREMENT APPROACH
The following section describes the use of sampling
techniques for measurements with two monitoring
points. In this work, an evaluation of the user and
network performance by measuring the user QoS
parameters is carried out. A performance
measurement method for estimating the actual
network QoS parameter experienced by the network
users has been proposed based on a sampling
technique. This is based on a passive monitoring
approach. The basic procedure is as follows: 1) Take
a suitable number of samples of the on-going current
traffic, 2) Measure the network performance based
on measuring the QoS parameters (delay, jitter, and
throughput) using the sampled packets, and 3)
Convert the sampled user version to represent the
(2)
(3)
(4)
(5)
(6)
(8)
(9)
(7)
ICETE 2005 - SECURITY AND RELIABILITY IN INFORMATION SYSTEMS AND NETWORKS
326
actual performance experienced by the user packets
by weighting the performance with the number of
user packets arriving between the sampled packets,
which is measured passively.
Some metrics require correlation and
synchronisation of data packets from different
monitoring points like delay. This work was based
on simulation, thus correlation was only considered
by recognising the packets at the second monitoring.
This can be done using packet-ID recognition
(Zseby et al., 2003). Both, correlation and
synchronisation must be considered in real network
The method described, above, was used to
estimate the actual end-to-end QoS parameters. To
demonstrate the application of this method, network
simulator ns2 was used (NS, 2005). Figure 4 shows
the network topology used for the simulation with
the same characteristics of the users as shown in
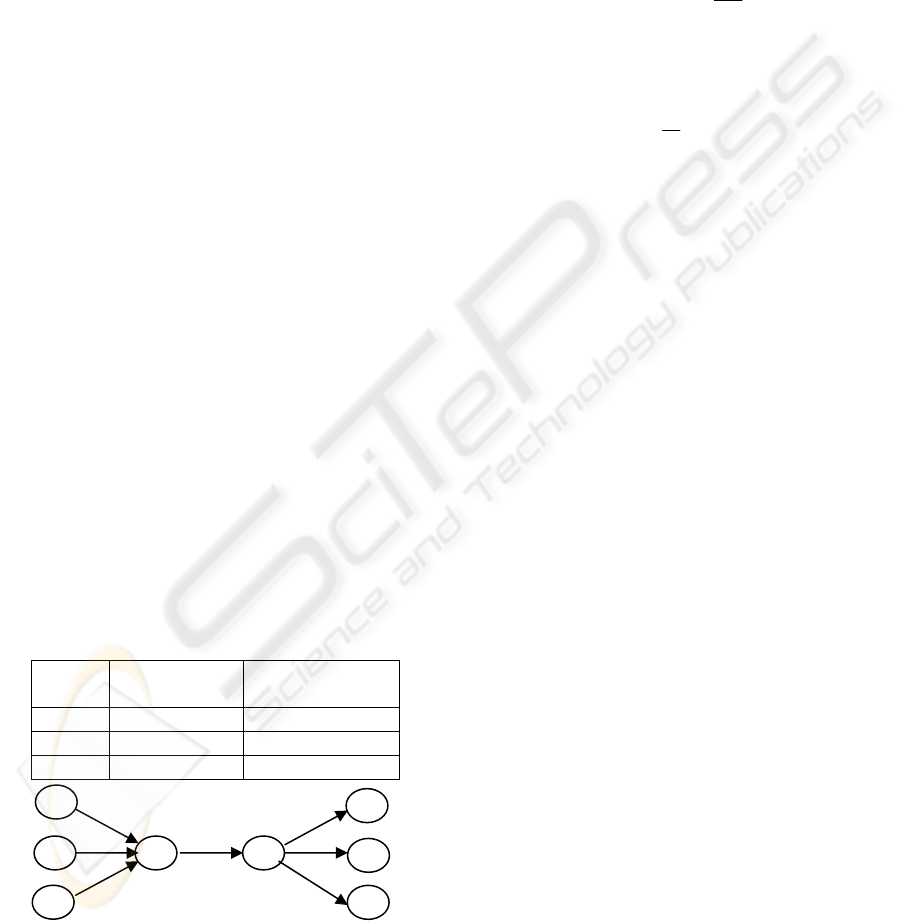
Table 1. It has three pairs of source/destination
hosts. Sources (N0, N1, and N2) were connected to
their destinations (N5, N6, and N7), respectively,
through two bottleneck routers (N3 and N4), which
are connected with each other via 2Mb/s link. All
the estimations will be done for user1. Other
simulation characteristics are as follows:
• The user's packets were generated by ON-
OFF negative exponential source. ON-OFF
means that the packets are either sent at full
rate with constant burst rate during the
"ON" period or not at all during the OFF
period. For these simulations, the mean ON
duration is set to 1 second and the mean
OFF duration is set to 5 seconds with
selected packet sizes and generation rates
for each application as shown in Table 1.
• The transport protocol was UDP protocol.
• Simulation time was 100 seconds.
Table (1): User's Characteristics
Figure 4: Network Topology
Let X
k
be the actual user QoS parameter to be
estimated and Y
j
is the measured parameter using the
sampled packets. The number of packets for user k
arriving in [s
j
, s
j+1
] is ρ
k
(j), and the number of total
packets for user k is:
()
∑
=
=
m
j
kk
jn
1
ρ
Then because there are one sampled packet in the
period [s
j
, s
j+1
] and ρ
k
user packets during that
period, and substituting this in equation (8), the
likelihood ratio will be:
() ()
k
kk
n
m
jjL
ρ
=
Substituting equation (11) in equation (8), the
estimate of the user parameter based upon the
sampled packet is:
()
(){}
()
∑
=
>
=
m
j
kaiY
k
y
j
n
amkZ
1
1
1
,,
ρ
Thus, by counting the number of user packets
arrived between two consecutive sampled packets,
the QoS parameters can be estimated. As an
example, the count-based trigger frequency was 50
packets for systematic sampling and 50 buckets for
stratified sampling.
5 EXPERIMENTAL RESULTS
5.1 Delay Estimation
An application of this method is to estimate the end-
to-end delay for the network or for a specific user.
The end-to-end delay for user1 will be estimated.
Figure 5 shows the delay distributions of the actual
user and an estimation of the user packet delay based
on the sampled packet using equation (12). It is clear
from Figure 5a that both the distribution of the
sampled packet delay and that of the estimated have
the same distributions. In addition, it can be seen
that the minimum user delay is about 22 msec using
the proposed method. This is equal to the minimum
value from the actual user delay distribution, which
is 22 msec. The maximum estimated delay value is
about 78 msec which is very close to the value from
the actual distribution which is about 80 msec. From
this it can be concluded that the user delay range is
between 22 and 80 msec. Therefore, in the case that
it is difficult to measure the actual delay range (or
the actual delay distribution); it is easy to obtain it
from the estimated one.
Figures 5b and 5c depict the distributions of the
measurements using the random and the stratified
sampling methods. In addition, from the Figures it is
obvious that the two estimation methods produce a
good representation of the actual user packet delay.
User Packet Size
[byte]
Generation Rate
[Mbps]
1 (N0) 600 1
2 (N1) 900 1.2
3 (N2) 800 1.2
N1
N2
N0
N7
N3
N4
N5
N6
(10)
(11)
(12)
ESTIMATION OF THE DISTRIBUTIONS OF THE QOS PARAMETERS USING SAMPLED PASSIVE
MEASUREMENTS TECHNIQUES
327

They gave also the same minimum and maximum
delay values as the systematic sampling for the
actual user delay. In addition, in the figures there are
some discrepancies between the sampled packet and
the actual user estimations that is due to the number
of sampled packets are small compared with the
number of the user traffic packets. Also, it is clear
that the discrepancies between the two distributions,
using the random sampling, are less than the other
sampling methodologies.
5.2 Throughput Estimation
Another application of this method is to estimate the
throughput of a specific user. The end-to-end
throughput of user1 will be, next, estimated.
Figures 6a, 6b, and 6c illustrate the distributions
of the actual user throughput and the estimated
throughput using equation (12). Figures show that
the sampled distribution versions produce good
representations of the actual user throughput. In
addition to that, all of them give an estimate of 1
Mbps of the user throughput which is the real
transmission rate of the user1.
Moreover, from these figures, it can be noticed
that there are some discrepancies between the actual
throughput distribution and the estimated one using
the systematic and stratified techniques. However,
the random sampling approach produced a very
accurate estimation of the actual throughput
distribution compared with the other two
approaches. Therefore, in cases of difficulties in
measuring the maximum throughputs and in
producing the estimate of actual throughput
distributions of a specific traffic, this method can
grant accurate measurement results.
5.3 Jitter Estimation
Here, the end-to-end jitter for user1 will be
estimated. Figures 7a, 7b, and 7c depict the jitter
distributions of the actual user packets and an
estimation of the user packet jitter using the three
sampling techniques using equation (12).
From these figures, it can be observed that all the
distributions produced by the three sampling
methods provide good illustrations of the actual user
jitter. It can be seen the discrepancies are also
obvious in the jitter estimation in both the systematic
and stratified sampling approaches. The random
sampling method produced a more accurate
distribution, which stands for the actual user jitter
distribution. From all distributions, it can be
estimated that the minimum and the maximum jitter
are 0 and 4.4msec respectively.
0 10 20 30 40 50 60 70 80 90
0
0.1
0.2
0.3
0.4
0.5
0.6
0.7
0.8
0.9
1
a [msec]
Pr(Delay>a)
User distribution
Estimated distribution
0 10 20 30 40 50 60 70 80 90
0
0.1
0.2
0.3
0.4
0.5
0.6
0.7
0.8
0.9
1
a [msec]
Pr(Delay>a)
User distribution
Estimated distribution
0 10 20 30 40 50 60 70 80 90
0
0.1
0.2
0.3
0.4
0.5
0.6
0.7
0.8
0.9
1
a [msec]
Pr(Delay>a)
User distribution
Estimated distribution
Figure 5: User delay and estimated user delay distributions using: (a) systematic, (b) random and (c) stratified sampling.
0 50 100 150 200 250 300 350 400 450
0
0.1
0.2
0.3
0.4
0.5
0.6
0.7
0.8
0.9
1
a [Kb/sec]
Pr(Throughput>a)
User distribution
Estimated distribution
0 50 100 150 200 250 300 350 400 450
0
0.1
0.2
0.3
0.4
0.5
0.6
0.7
0.8
0.9
1
a [Kb/sec]
Pr(Throughput>a)
User distribution
Estimated distribution
0 50 100 150 200 250 300 350 400 450
0
0.1
0.2
0.3
0.4
0.5
0.6
0.7
0.8
0.9
1
a [Kb/sec]
Pr(Throughput>a)
User distribution
Estimated distribution
Figure 6: User throughput and estimated user throughput distributions using: (a) systematic, (b) random and (c) stratified
sampling.
(a)
(b)
(c)
(a)
(b)
(c)
ICETE 2005 - SECURITY AND RELIABILITY IN INFORMATION SYSTEMS AND NETWORKS
328

0 1 2 3 4 5
0
0.1
0.2
0.3
0.4
0.5
0.6
0.7
0.8
0.9
1
a [msec]
Pr(Jitter>a)
User distribution
Estimated distribution
0 1 2 3 4 5
0
0.1
0.2
0.3
0.4
0.5
0.6
0.7
0.8
0.9
1
a [msec]
Pr(Jitter>a)
User distribution
Estimated distribution
0 1 2 3 4 5
0
0.1
0.2
0.3
0.4
0.5
0.6
0.7
0.8
0.9
1
a [msec]
Pr(Jitter>a)
User distribution
Estimated distribution
Figure 7: User jitter and estimated user jitter distributions using: (a) systematic, (b) random and (c) stratified sampling.
6 CONCLUSIONS
This work highlights the deployment of sampling
techniques for estimating of QoS parameters of an
ON-OFF exponential traffic. Experiments were
performed with systematic, random, and stratified
sampling. These methods showed how the
estimation of the end-to-end QoS parameters could
be achieved using two monitoring points without the
necessity for calculating the whole QoS parameter
population using sampling technique. Also, this
method had the advantage, over the active method,
of not adding an extra load to the network. In
addition, unlike the passive approach, which
requires the transfer and calculations of the whole
traffic data.
From this study, it could be concluded that all
three sampling methods provided an accurate
measure of the QoS parameters. It was obvious that
this method produces an acceptable estimation of
QoS parameters. Nevertheless, for the network
topology and traffic conditions used, the random
sampling showed the best overall performance
because it, randomly, selects the packets for
sampling, which will represent the random
conditions of the network. This could estimate not
only the actual performance of individual users and
applications but also the mixed performance
experienced by these users. The estimation of mixed
users performance will be one of the issues for
future work in this study.
REFERENCES
CAIDA cooperative association for internet data analysis,
2005. Accessing the internet,
http://www.caida.org/tools/
. (18 February 2005).
Aida, M., Ishibashi, K., and Kanazawa, T., 2002.
CoMPACT-Monitor: Change-of-measure based on
passive/active monitoring-weighted active sampling
scheme to infer QoS. In SAINT'02w, Symposium on
Application and Internet, IEEE Computer Society.
Ishibashi, K., and Kanazawa, T., Aida, M., and Ishii, H.,
2004. Active/passive combination-type performance
measurement method using change-of-measure
framework. ELSEVIER Computer Communication 27,
886-879.
Zseby, T., 2002. Deployment of sampling methods for
SLA validation with non-intrusive measurements. In
PAM2002, Passive and Active Measurement
Workshop, USA.
Claffy, K.C., Polyzos, G.C., and Braun, H., 1993
Application of sampling methodologies to network
traffic characterization. In ACM SIGCOMM'93, USA.
Bohdanowicz, A. and Weber, J.H., 2002. Conceptual
framework of integrated variance reduction techniques
for evaluation of communication systems. In
CCN2002, IASTED International Conference on
Communications and Computer Networks, USA.
Zseby, T., Mark, C. Schmoll, and Pohl, G., 2003. Passive
one-way-delay measurements and data export. In IPS,
1
st
International workshop on Inter-domain
Performance and Simulation, Salzburg,
Network Simulator (NS-2), 2005. [Online]. Accessing the
internet http://www.isi.edu/nsnam/ns
.(15 February
2005).
(a)
(b)
(c)
ESTIMATION OF THE DISTRIBUTIONS OF THE QOS PARAMETERS USING SAMPLED PASSIVE
MEASUREMENTS TECHNIQUES
329
