
PROPERTIES OF DOMINANT COLOR TEMPERATURE
DESCRIPTOR
Karol Wnukowicz, Wladyslaw Skarbek
Faculty of Electronics and Information Technology,Warsaw University of Technology,
Nowowiejska 15/19, 00-665 Warsaw, Poland
Keywords: Image indexing, Image databasess, Color temperature.
Abstract: The concept of color temperature is derived from an innate characteristics of the human visual system. It is
formulated as a visual feature
referring to a kind of perceptual feeling about perceived light. Color
temperature has also a physical-based definition, and hence, color temperature of observed scenes and
visual objects can be modelled in a mathematical way as a one-parameter characteristics of perceived light.
In the Amendment to the Visual Part of the MPEG-7 Standard the Color Temperature descriptor for image
browsing has been proposed. To extend the functionality of content-based image search by color
temperature we proposed the Dominant Color Temperatures descriptor, which allows a user to perform
query by example and query by value searches. The extraction algorithm was originally adopted from
dominant color’s one, which utilizes vector quantization in 3D color space. We also proposed a second,
much faster algorithm based on scalar quantization in one-dimensional color temperature space. In this
paper we present a comparison of the two extraction algorithms. We also compare the querying results of
the Dominant Color Temperature descriptor and two conceptually related descriptors: Dominant Color and
Color Temperature.
1 INTRODUCTION
Color temperature is a feature of light, associated
with color (Wyszecki, Stils, 1982), and is derived
from light perception of the human visual system.
Color temperature is a promising feature in content-
based image indexing, because viewers can easily
judge perceptual image similarity using color
temperature. The Amendment to the Visual Part of
the MPEG-7 Standard (ISO/IEC, 2004) specifies the
Color Temperature descriptor, which refers to the
color temperature of image scene illumination (Kim,
Park, 2001a). It is extracted by an iterative
procedure, in which the average color of pixels
having significant influence on color temperature
perception is estimated. This descriptor is mainly
intended for image browsing by classification of
images into one of the four given subjective color
temperature categories: hot, warm, moderate, cool.
Its usefulness in search tasks of other kinds, such as
query by example or query by color temperature
value is rather poor. Another limitation of this
descriptor is that images may contain a few regions
of different color temperatures, in such a case the
average color only roughly estimates the perceived
color temperature of images, and a significant piece
of information about color temperature content
might be lost.
In some applications the user may want to have
th
e possibility for a more powerful searching, and
for a more precise ranking of query results than it is
possible using the simple Color Temperature
descriptor. Moreover, two other kinds of queries for
color temperature-based search, in addition to the
subjective categorization, may be of the user
interest. The first is a query by value, in which the
user simply inputs the required color temperature in
Kelvin degrees, and the system retrieves images
having the perceived color temperature closest to the
user input. The second type of query is a query by
example, in which the user chooses an example
image, and the system retrieves the most similar
ones. The example image may be a real image or an
image drawn by the user as a colored sketch. This
type of query is possible for other color descriptors
contained in the MPEG-7 Standard (ISO/IEC,
2002b): Color Histogram (Scalable Color),
Dominant Color, Color Structure, Color Layout, but
is not available for the Color Temperature
descriptor. These two search functionalities can be
171
Wnukowicz K. and Skarbek W. (2005).
PROPERTIES OF DOMINANT COLOR TEMPERATURE DESCRIPTOR.
In Proceedings of the Second International Conference on e-Business and Telecommunication Networks, pages 171-176
DOI: 10.5220/0001409101710176
Copyright
c
SciTePress

achieved using Dominant Color Temperatures
descriptor, which describes a few representative
color temperatures in an image. We proposed two
algorithms for extraction of the descriptor. One of
them is similar to the extraction method of the
MPEG-7 Dominant Color descriptor (Wnukowicz,
2004). But that method is not optimally suited for
dominant color temperatures extraction, and is also
computationally costly (vector quantization of pixel
values in 3D color space). To avoid these
drawbacks, we proposed a new extraction algorithm
(Wnukowicz, 2005) based on scalar quantization in
one-dimensional color temperature domain. The
syntax of the Dominant Color Temperatures
descriptor remains the same as the originally
proposed one. Section 2 outlines the extraction
methods, and section 3 presents experiments for
comparison of the methods.
Although Dominant Color Temperature
descriptor relates conceptually to two other
descriptors: Dominant Color and Color
Temperature, there are significant differences
between them. We carried out some experiments for
comparing the results obtained by those descriptors
and Dominant Color Temperatures descriptor for a
test dataset of images. They are presented in sections
4 and 5.
2 EXTRACTING DOMINANT
COLOR TEMPERATURES
The general idea of the Dominant Color
Temperatures descriptor is to describe images by
color temperatures of their representative colors.
This will result in more precise description of
images regarding color temperature feature in
comparison with the one-parameter Color
Temperature descriptor. The Dominant Color
Temperature descriptor extends the functionality of
image searching using color temperature by enabling
two additional types of queries: query by color
temperature value and query by example. Other
types of queries are also possible, of which examples
are the following:
− find images that contain at least 80% of
dominant colors with warm color temperature
category;
− find images that contain regions of different
color temperature categories (for example
warm>20% and moderate>40%);
− rank query result according to the relevance to
the user query.
The originally proposed method for dominant
color temperatures extraction is based on the
extraction algorithm for dominant colors (ISO/IEC,
2002a). This solution is justified by the fact that
perceptually distinct dominant colors are obtained
by averaging color values of similar group of pixels
in an image. The averaging of color values for pixels
which influence color temperature perception is also
used in extraction of the Color Temperature
descriptor (Kim, Park, 2001b).
The overall scheme of the dominant-color-based
extraction method can be outlined in the following
steps:
1. Extract the dominant colors of an image using
the GLA color quantization algorithm;
2. Compute the chromaticity coordinates on uv
plane for each dominant color;
3. Compute the color temperatures from the
chromaticity coordinates for each dominant
color;
4. Construct the descriptor as an array of elements
that hold values and percentages of the color
temperatures in the image. The “black” colors
are not included into the descriptor.
To extract the descriptor, first, up to eight dominant
colors of the image are obtained, and next, color
temperatures for the dominant colors are estimated.
As a result K pairs of values [t
i
, p
i
] are obtained,
where t
i
denotes color temperature value, p
i
denotes
percentage of pixels with color temperature t
i
, 0 ≤ i ≤
K-1, and K ≤ 8.
The dominant color based approach for dominant
color temperatures extraction has two significant
drawbacks. The first is a high computational cost
caused by the vector quantization of pixel values in
3D color space. The second drawback is that
dominant colors do not always correspond to distinct
color temperature values. For example, two distinct
dominant colors, light-red and dark-red, may have
undistinguishable color temperatures. The better
solution would be if the dominant color temperatures
were well distinguishable. Such solution is the
extraction method proposed in the second algorithm
(Wnukowicz, 2005).
The new extraction algorithm is based on scalar
quantization in one-dimensional color temperature
domain. The algorithm can be outlined in the
following steps:
1. Compute color temperature values, in reciprocal
megakelvin scale, for all pixels in the image;
2. Mark pixels without significant color
temperature values, that should be omitted (e.g.
black colors);
3. Compute a histogram of color temperature for
the remaining pixels;
4. Perform scalar quantization of the histogram
bins to obtain dominant color temperatures;
5. Merge similar dominant color temperature bins
(by using a merging threshold).
ICETE 2005 - MULTIMEDIA SIGNAL PROCESSING
172
The histogram is computed from pixel samples
represented by color temperature values. The values
of color temperature are converted to reciprocal
megakelvin scale (mired, 1MK
-1
=1000000/K),
which is usually used in color temperature
calculations instead of Kelvin scale. Values of the
samples are clipped to the range from 40 MK
-1
(25000K) to 600 MK
-1
(1667K), and quantized with
step q. The resulting histogram has (600-40)/q bins.
We used q=1, what gives 560 bins in the histogram.
Scalar quantization is performed by modified Lloyd
algorithm (Lloyd, 1982) in color temperature
histogram domain. The range of color temperature
values is being split into K subranges, the mass
centers of the histogram subranges are considered to
be the representative points of the relevant
subranges. The algorithm calculates (locally)
optimal division of the color temperature range into
K subranges having minimum distortion. The
distortion is calculated as a sum of distances from
the representative points of each subrange to the
color temperature values represented by positions of
histogram bins contained within this subrange,
weighted by values of the relevant histogram bins. K
obtained representative points are candidates for the
dominant color temperatures. In the next step, the
color temperature representative points which are
closer to each other than a given merging threshold
T
merg
are merged to obtain perceptually distinct
dominant color temperatures.
3 COMPARISON OF THE
EXTRACTION METHODS
The experiments for comparison of the two
extraction methods were performed using a test
dataset from core experiments of the MPEG-7 Color
Temperature descriptor (Kim et al., 2001c). In those
experiments 3056 test images were classified into
four color temperature categories according to
subjective user’s voting. The subjective categories
were: hot (reddish colors dominate), warm (orange
and yellowish colors), moderate (white, grey, green
colors) and cool (bluish colors).
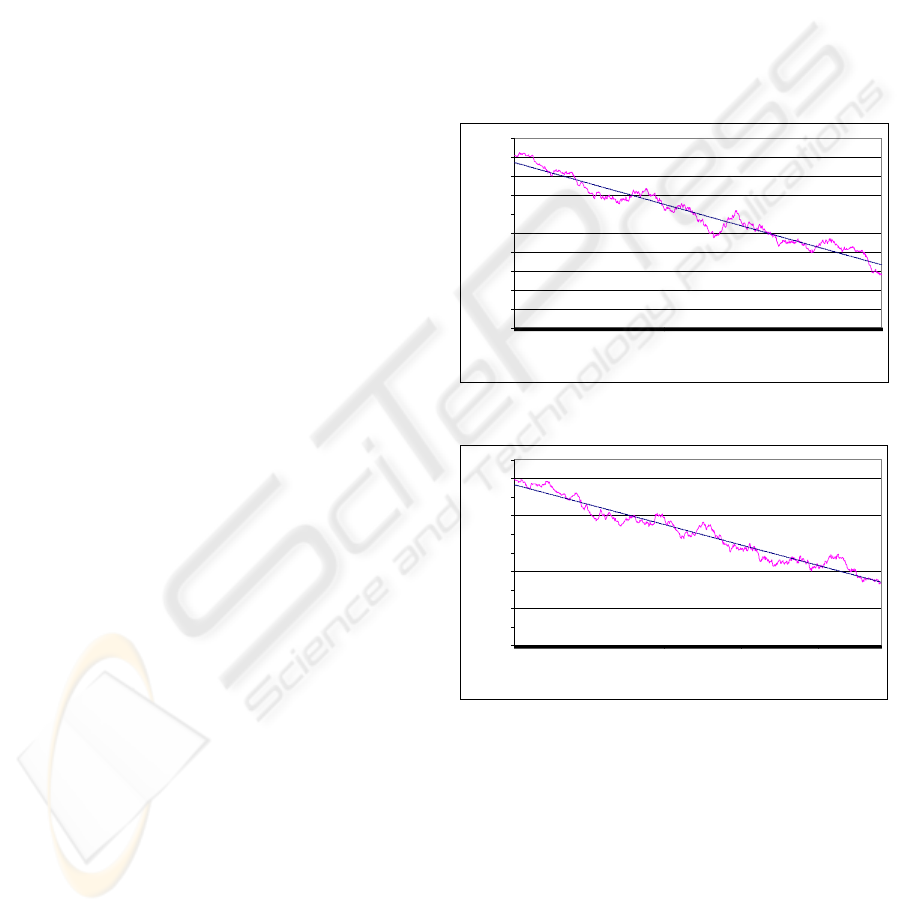
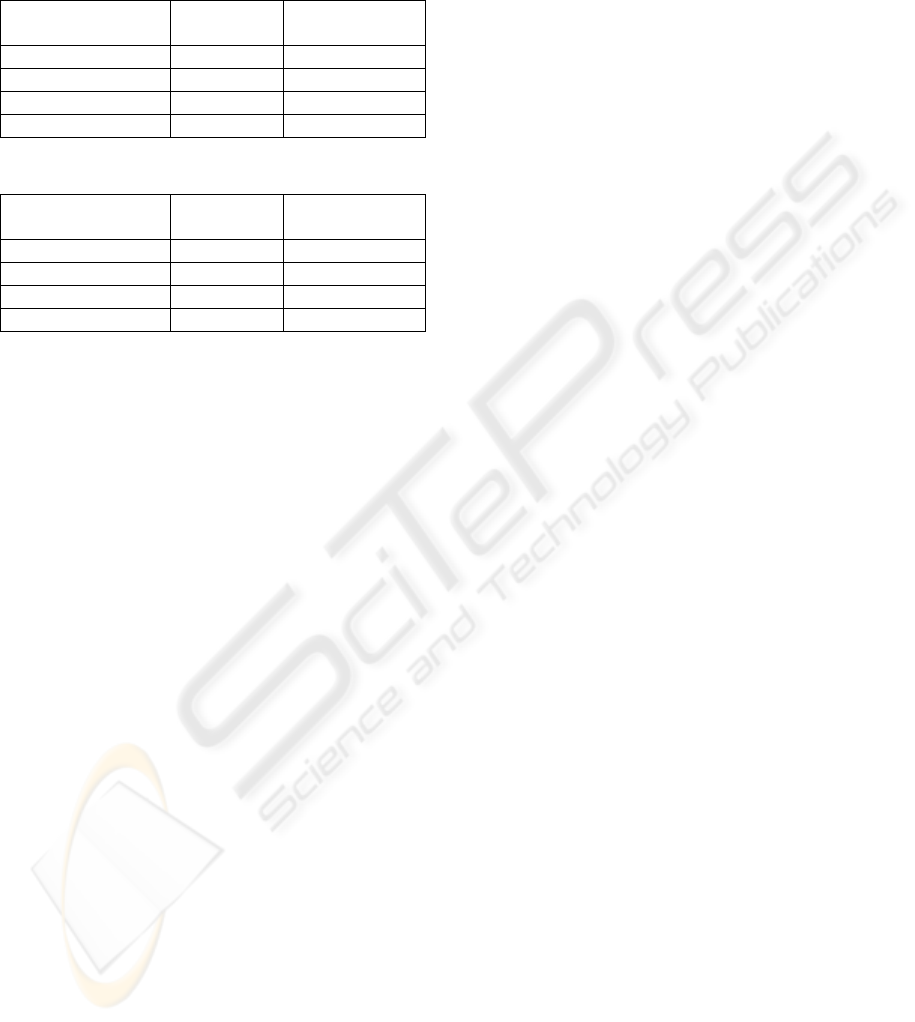
Figure 1 and 2 show graphs which depict ranking
of query result of the test images for moderate color
temperature category. The graphs depict
relationships between the viewer’s subjective
assessment of images and the ranking of query
results for the two extraction methods of Dominant
Color Temperatures descriptor. The vertical axes in
both graphs represent percentage of viewer’s votes
assigning images to moderate color temperature
category. The horizontal axes represent image
positions on the ranked result lists for moderate
category. Figure 1 shows the result for the new
extraction method (scalar quantization), and figure 2
shows the result for the original extraction method.
The ranking of query result were done according to
the distance to reference color temperature of a
chosen subjective category as explained in
(Wnukowicz, 2004), and the reference color
temperature RT
REF
=181,92 MK
-1
was taken for the
experiments (the middle of the moderate category
subrange in reciprocal scale). The user votes (given
in %) were smoothed in the graphs by averaging in a
shifted window of 50 consecutive images. As it can
be intuitively assumed, it is desirable that images
positioned at the beginning of the result list had the
percentages of viewer’s votes close to 100%.
0
10
20
30
40
50
60
70
80
90
100
0
44
88
132
176
220
264
308
352
396
440
484
528
572
616
660
704
748
792
836
880
924
image position
smoothed percentage of votes
Figure 1: Ranking of query result for the scalar-
quantization-based extraction algorithm
0
10
20
30
40
50
60
70
80
90
100
1
45
89
133
177
221
265
309
353
397
441
485
529
573
617
661
705
749
793
837
881
925
image position
smoothed percentage of votes
Figure 2: Ranking of query result for the dominant-color-
based extraction algorithm
Additionally, the graphs contain lines which best
fit the smoothed relationships for the two
descriptions. The line parameters were obtained by
linear regression of the data. The equation of the
approximated line is y=a*x+b, where x is the image
position (horizontal axis of the graph), y is the
smoothed percentage of votes value, a is the slope of
the line, and b is the intersection of the line with the
vertical axis of the graph (intercept, percentage of
votes for the first positioned image on the retrieved
list). Table 1 shows start points (b parameter values)
of the lines for all of the four subjective color
PROPERTIES OF DOMINANT COLOR TEMPERATURE DESCRIPTOR
173
temperature categories, table 2 shows average
deviations of the data points from the approximated
lines. In table 1 the bigger value is the better. In
table 2 the smaller value is the better.
Table 1: The first point of the regression line (b parameter)
Color temperature
category
Scalar
quantization
Dominant color
quantization
Hot 91.69 92.26
Warm 75.23 73.76
Moderate 87.12 86.5
Cool 87.91 87.46
Table 2: Average squared deviation of percentage of votes
(regarding regression line)
Color temperature
category
Scalar
quantization
Dominant color
quantization
Hot 5.36 5.47
Warm 13.03 15.7
Moderate 13.13 11.42
Cool 6.98 6.22
The main advantage of the new extraction
method is a significant decrease of the
computational complexity, as it utilizes scalar
quantization of 1D color temperature histogram with
fixed size instead of vector quantization in 3D color
space with complexity depending on image size. In
the case of vector quantization, the most time
consuming task is an iterative process of clustering,
which is performed by finding the nearest
representative point for each pixel of the indexed
image, until the change of quantization error in two
consecutive iterations comes down below an
established threshold. For example, if we have an
image of the size MxN and K representative color
points, the number of distance calculations needed is
MxNxK, The distance between two colors [l
1
, u
1
, v
1
]
and [l
2
, u
2
, v
2
] in 3D color space is given by: (l
1
- l
2
)
2
+ (u
1
- u
2
)
2
+ (v
1
- v
2
)
2
, where l, u, v are color
components in LUV color space, which is used due
to its perceptual homogeneity. It means that
computation of a single distance requires 3
subtractions, 3 multiplications and 2 additions. For
M=256, N=256, K=8, the number of distance
calculations in a single clustering step is: 256 x 256
x 8 = 524288. Quantization may need a few dozen
iterations of clustering.
In the case of color temperature histogram the
quantization is performed in one dimensional space
for data of fixed size. The clustering is done, by
assigning subrange’s cut points between neighboring
representative color temperature values. The
quantization error is computed by summing up the
distances from the representative points to assigned
to them color temperature values represented by
histogram bins, weighted by histogram bin values.
This task needs B distance calculations, involving
two basic operations: subtraction and multiplication,
where B is the number of histogram bins (e.g.
B=560). Experiments showed that even for small
images (384x256) the generation of indexes is more
than two times faster when the new algorithm is
used. For bigger images the difference in
computation time could be even greater.
4 COMPARISON OF DOMINANT
COLOR TEMPERATURES AND
COLOR TEMPERATURES
To compare the Dominant Color Temperature
descriptor and the Color Temperature descriptor,
experiments of ranking the search results were
carried out, where matching according to human
perception was evaluated. It was assumed that the
order of retrieved images should match the user
perception. The measure of matching to subjective
tests was performed by evaluation of smoothed vote
percentage graphs in image rank domain, which was
obtained as specified in the previous section.
Experiments were performed for all of the four
color temperature categories, for the Dominant
Color Temperature descriptor, and for the Color
Temperature descriptor. In the case of Color
Temperature descriptor the query results were
ranked according to the distance from color
temperature of image to the reference color
temperature value of relevant subjective category.
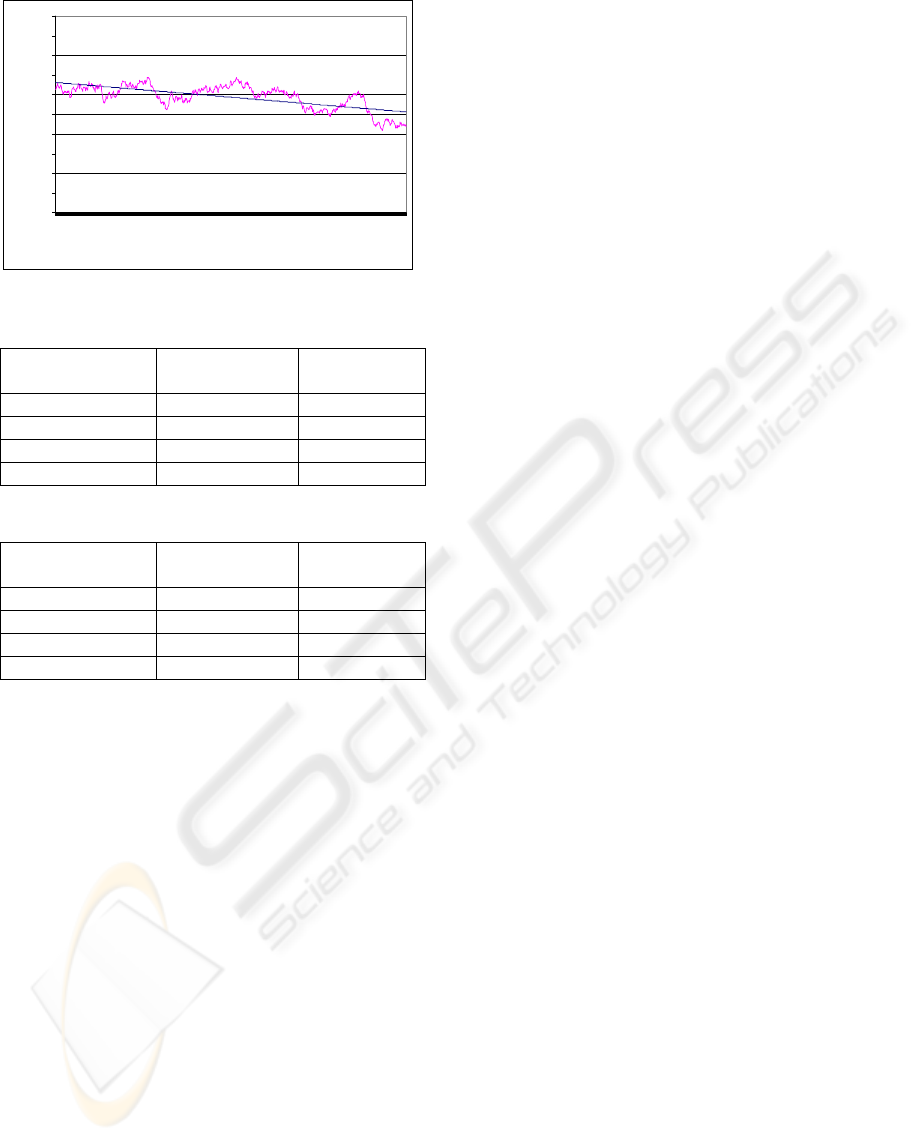
The graph of the query result ranking for the
moderate color temperature category is depicted in
figure 3. Tables 3 and 4 contain the parameters of
estimated regression lines for all categories.
The results of the experiments show that
searching by the Dominant Color Temperature
descriptor matches the subjective assessment of
color temperature. This matching is generally better
than in the case of the Color Temperature descriptor,
but the largest improvement is achieved for
moderate category, as it can be easy seen when
comparing the graph in figure 3 with the ranking of
the Dominant Color Temperature descriptor depicted
in figures 1 and 2. This is due to the fact that images
which belong to the moderate category have the
largest variation of dominant colors, and the varied
dominant color temperatures could not be well
discriminated by one-parameter descriptor.
ICETE 2005 - MULTIMEDIA SIGNAL PROCESSING
174
0
10
20
30
40
50
60
70
80
90
100
1
45
89
133
177
221
265
309
353
397
441
485
529
573
617
661
705
749
793
837
881
925
imag e po s itio n
smoothed percentage of votes
Figure 3: Ranking of query result for Color Temperature
descriptor (moderate category)
Table 3: The first point of the regression line (b parameter)
Color temperature
category
Dominant color
temperatures
Color
temperature
Hot 91.69 90.83
Warm 75.23 74.12
Moderate 87.12 66.14
Cool 87.91 84.91
Table 4: Average squared deviation of percentage of votes
(regarding regression line)
Color temperature
category
Dominant color
temperatures
Color
temperature
Hot 24.96 5.47
Warm 7.039 15.7
Moderate 20.34 11.42
Cool 12.58 6.22
The experiments show that in the case of the
Dominant Color Temperatures descriptor the user
perception corresponds better to search results
obtained for all of the four subjective color
temperature categories with the following reference
values: 1667K (hot), 2924K (warm), 5497K
(moderate), 25000K (cool). However, this justifies
the suitability of this descriptor to be used for any
other color temperature value that a user may want
to query for in a search application.
5 COMPARISON OF DOMINANT
COLOR TEMPERATURES AND
DOMINANT COLOR
Although the Dominant Color Temperature
descriptor is based on the Dominant Color
descriptor, there are significant differences between
them. We carried out some tests comparing the
query results obtained by the two descriptors for test
images from the dataset.
There are at least three conceptual differences
between the two descriptors:
− differences between concepts of color and color
temperature. Dominant colors in an image of a
dissimilar appearance may at the same time
make an impression about the image to be
similar regarding their dominant color
temperatures, e.g. gray/green, orange/pink;
− different concepts of similarity measure for
query by example. In the case of the Dominant
Color descriptor, images are considered to be
similar if they have regions with very close
colors and similar percentages (ISO/IEC,
2002a). Images can have minor regions with
highly dissimilar colors. In the case of Dominant
Color Temperature the emphasis is on the
overall similarity of dominant color
temperatures and their percentages, so single
regions which have dissimilar color
temperatures make images be more dissimilar;
− the Dominant Color Temperature descriptor is
intended to be an enhancement of the Color
Temperature descriptor by functionalities such
as query by example, query by value, image
ranking, and searching for images with multiple
color temperatures.
To compare the Dominant Color descriptor and the
Dominant Color Temperature descriptor a set of
queries has been performed for the test dataset (3056
images) and image positions on the retrieved lists
were registered.
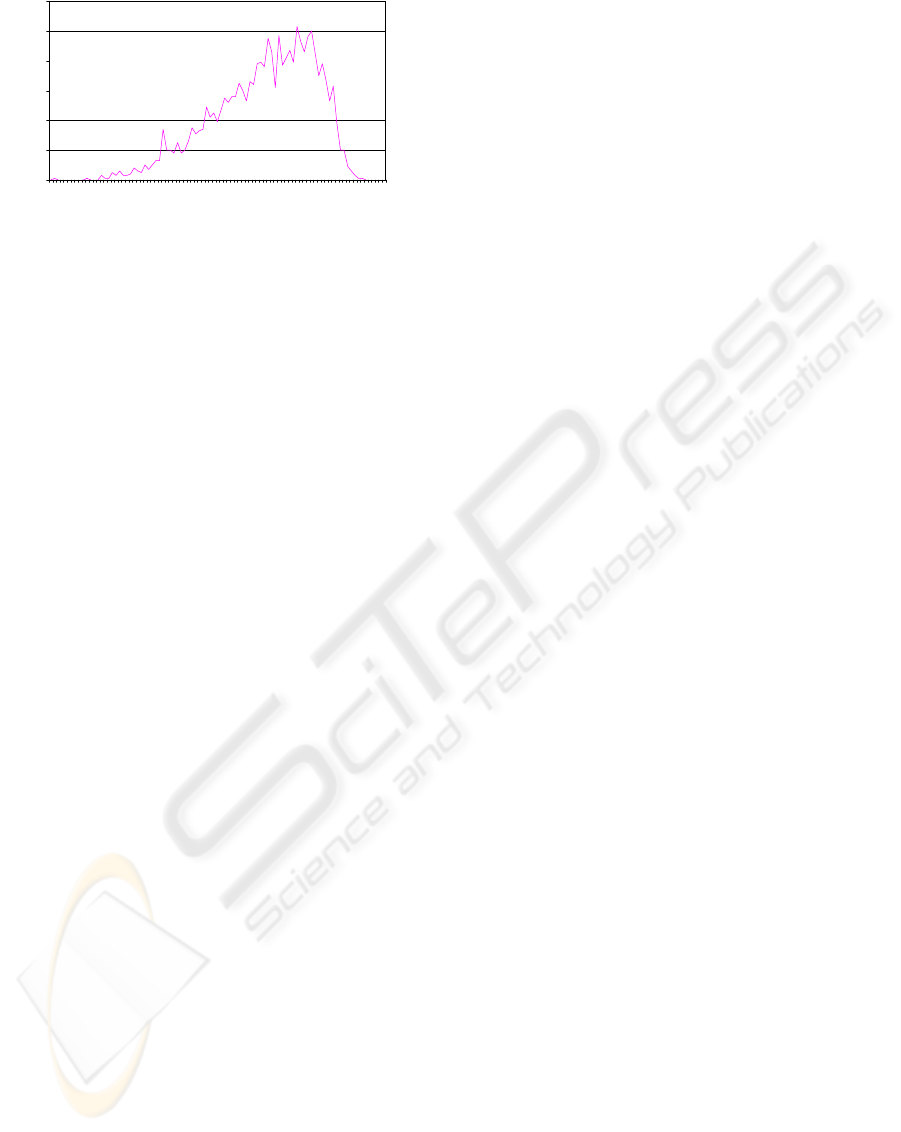
The result of experiments for comparing the
ranking of query results for the two descriptors is
presented in the graph in figure 4. The graph shows
histogram of correlation of ranked query results for
the two descriptors: Dominant Colors and Dominant
Color Temperatures. The variables used for
computing the correlations were image positions on
two ranked result lists obtained for the two
descriptors (image positions were in the range from
1 to 3056). For each image from the test dataset two
queries using the two descriptors were performed,
the results were ranked and the positions of retrieved
images were registered, which were used as input
variables to compute the correlation of image
positions.
Correlations were computed for 3056 queries
(each image in the dataset was a query), and the
histogram presents the results (correlation values are
smoothed with step 0.01). Pearson formula was used
to compute the correlation, where 0 means no
correlation between variables, 1 indicates maximum
correlation (the datasets are the same), -1 means that
variables are inversely correlated.
PROPERTIES OF DOMINANT COLOR TEMPERATURE DESCRIPTOR
175
0
20
40
60
80
100
120
-
0
,33
-0
,
2
9
-
0
,2
5
-
0
,21
-0,
1
7
-
0
,13
-0,
0
9
-0
,
0
5
-
0
,01
0,
03
0,
07
0
,
1
1
0,15
0
,
1
9
0
,
2
3
0,
27
0
,
3
1
0
,
3
5
0,39
0
,
4
3
0,47
0,51
0
,
5
5
0,59
Correlation
Number of images
Figure 4: Correlation of query results for Dominant Color
Temperatures and Dominant Color descriptors
As it can be seen in the diagram, the correlations
span values from -0.32 to 0.53, but the average value
is about 0.26, so the correlation between results
obtained by dominant colors and dominant color
temperatures is not very high. This confirms that the
two descriptors give different search functionalities.
6 CONCLUSIONS
We have presented some experiments demonstrating
the properties of the Dominant Color Temperatures
descriptor, which was designed for content-based
image searching. First, two available extraction
algorithms have been compared. The originally
proposed algorithm makes it possible to extract the
Dominant Color Temperatures descriptor directly
from the Dominant Color descriptor, what may be
an advantage in same cases. But generally the new
algorithm, which uses fast scalar quantization in
color temperature domain, is a better solution for
extraction of the Dominant Color Temperatures
description.
We also compared this descriptor with two
conceptually related visual descriptors: Color
Temperature and Dominant Color. On the one hand
the Dominant Color Temperatures descriptor can be
regarded as an enhancement to the Color
Temperature descriptor – it support new
functionalities of searching by color temperature. On
the other hand it have significantly different
properties than the Dominant Color descriptor.
ACKNOWLEDGMENT
The work presented was developed within VISNET,
a European Network of Excellence
(http://www.visnet-noe.org), funded under the
European Commission IST FP6 programme
REFERENCES
ISO/IEC, 2002a. Information technology - Multimedia
content description interface – Part 8: Extraction and
Use of MPEG-7 Descriptions, ISO/IEC 15938-8.
ISO/IEC, 2002b. Information technology – Multimedia
content description interface – Part 3: Visual,
ISO/IEC 15938-3.
ISO/IEC, 2004. Information technology – Multimedia
content description interface – Part 3: Visual,
AMENDMENT 1: Visual extensions, ISO/IEC
15938-3/AM 1.
Kim, S.-K., Park, D.-S., 2001a. Proposal for Color
Temperature Descriptor for image description,
ISO/IEC JTC1/SC29 WG11 M6966, Singapore.
Kim S.-K., Park D.-S., 2001b. Report of VCE-6 on
MPEG-7 color temperature browsing descriptors,
ISO/IEC JTC1/SC29/WG11 M7265, Sydney.
Kim, S.-K., Park, D.-S., Choi, Y., 2001c. The Ground
Truth Set of VCE-6 on MPEG-7 color temperature
browsing descriptors, ISO/IEC JTC1/SC29/WG11,
Pattaya.
Lloyd, S. P., 1982. Least Squares Quantization in PCM, In
IEEE Transactions on Information Theory, IEEE
Press.
Wnukowicz K., 2004. Image Indexing by Distributed
Color Temperature Descriptions, Fundamenta
Informaticae, vol. 61, no. 3-4.
Wnukowicz, K., Skarbek, W., 2005. Extracting dominant
color temperatures, In WIAMIS’05, International
Workshop on Image Analysis for Multimedia
Interactive Services.
Wyszecki, G., Stiles, W. S., 1982. Color Science Concepts
and Methods, Quantitative Data and Formulae, A
Wiley-Interscience Publication, 2nd Edtion, New York.
ICETE 2005 - MULTIMEDIA SIGNAL PROCESSING
176
