
A NOVEL TRANSFER POLICY MODEL TO ENHANCE THE
SERVICEABILITY OF AN E-BUSINESS
Jason C.T. Lo, Allan K.Y. Wong and Wilfred W.K. Lin
Department of Computing, Hong Kong Polytechnic Univeristy, Hung Hom, Kowloon, Hong Kong S.A.R.
Keywords: SDITPM, primary metrics, secondary metrics, PID, planar integration, vertical integration, pervasive
computing.
Abstract: The novel statistical distribution independent transfer policy model (SDITPM) is proposed to improve the
serviceability of a logical agent server in a pervasive computing environment. Serviceability is defined as
the “chance of obtaining a required service within a defined period”. The SDITPM helps the agent to make
sound migration decision by leveraging different primary metrics from which secondary ones are derived
for the proportional (P), derivative (D), and integral (I) control elements. These elements are timely
combined by planar and vertical integrations to form the final transfer probability that affirms a transfer
policy decision to migrate. Therefore, The SDITPM is basically a PID controller that facilitates the decision
making process.
1 INTRODUCTION
Traditionally migration of logical entities is a way to
improve system dependability (Avizienis, 2004) and
performance. A logical entity such as an application
may migrate for many reasons, for example: a) to
reduce the host’s load and as a result workload is
evened out (i.e. load balancing), and b) to self-
preserve because the host becomes unreliable (e.g.
continued power jitters). In the UNIX perspective
migration of a logical entity is basically process
migration of the following steps: a) the transfer
policy makes the migration decision, b) the location
policy finds the target node, c) the target nodes starts
a new process, d) the old node passes on the
execution states and object code of the suspended
logical entity, and e) the migrant starts running with
the new process in the new node (Coulouris, 2001).
In this era of the Remote Programming Paradigm
(Cockyane, 1997) agent mobility is a necessity.
Agent migration entails all the steps in process
migration but differs by carrying the object class
from which the executable code is generated locally.
This avoids any incompatibility between the pre-
compiled code and the local architecture because the
Internet is naturally heterogeneous. The SDITPM
leverages primary metrics such as the host’s context
switching cycle time, and the length of the agent
server’s queue of requests. The leveraging accuracy
and speed are independent of the distribution of the
parametric values because this is carried out by the
SDITPM’s CA (Convergence Algorithm) component
(Wong, 2001). The overall CA operation is
summarized by the equations (1) and (2).
i
M is the
distribution mean estimated for the period in which
the F (flush limit) number of data samples are
collected. F=14 is used because it yields the fastest
convergence to
i
M
(Wong, 2001). The other
parameters are: a)
1−i
M
is the feedback of the last
estimated mean to the current estimation cycle, b)
i
j
m is the j
th
sample in the i
th
i
M
estimation cycle,
)1(,3,2,1
−
=
Fj , and c)
0
M
is the first data
sample when CA had first started running.
1);2.(..........);1(..........
1
00
1
1
1
≥=
+
=
=
=
−=
=
−
∑
imM
F
mM
M
i
j
Fj
j
i
ji
i
160
Lo J., Wong A. and Lin W. (2005).
NOVEL TRANSFER POLICY MODEL TO ENHANCE THE SERVICEABILITY OF AN E-BUSINESS.
In Proceedings of the Second International Conference on e-Business and Telecommunication Networks, pages 162-166
DOI: 10.5220/0001408501620166
Copyright
c
SciTePress
2 THE STATISTICAL
DISTRIBUTION
INDEPENDENT TRANSFER
POLICY MODEL (SDITPM)
The transfer decision making process by the
SDITPM is divided into three main parts: a)
leveraging primary parameters by the PID approach,
b) computing the transfer probability (TP), c)
computing the cost index (CI) and affirming the
migration decision if “
TP
C
O
ThresholdTP >
AND
CI
C
O
ThresholdCI <<
” is satisfied. It treats a
primary metric (e.g. server’s queue length
Q )
simply as a waveform. It derives from a primary
metric three secondary ones: a) the “current sampled
mean (of the waveform) over the last one sampled”
ratio for proportional (P) control, b) “current
sampled rate of change” for derivative (D) control,
and c) deviation errors for integral (I) control. The
corresponding
2
},0{ ∆ objective functions compute
the P and D deviation errors, where “0” and
∆
symbolically mark the reference point and the safety
margin about this point respectively. The deviation
error measures how much a secondary metric has
gone beyond the
∆±
safety band. SDITPM
selectively and timely uses the P, I, and D controls
to compute the overall transfer probability so that
the transfer policy can affirm a migration decision.
Every primary metric is uniquely identified by l ,
sll ,...2,1= .Similarly every secondary metric (SM)
is identified by s,
sks ,...2,1=
. For
example,
2,3,
SMSM
sl
= indicates the 2
nd
secondary metric derived from the 3
rd
primary
metric. If the primary metric is the agent server’s
queue length
Q , the current rate of Q changes (i.e.
dt
dQ
) can be its 2
nd
secondary metric. P and D
controls together forms the 2-dimensional control
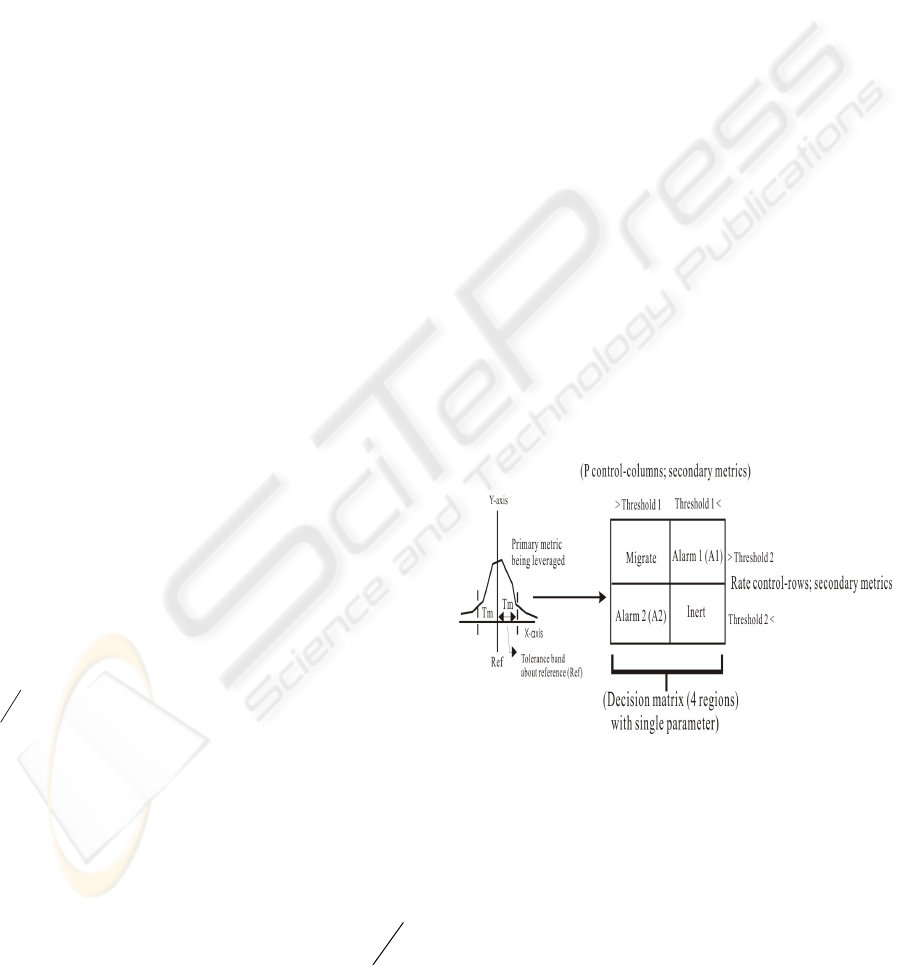
plane shown in Figure 1. The 3
rd
dimension is the
perpendicularly “incidental” I control. The plane has
four control regions: “Migrate”, “Alarm 1 (or A1)”,
“Alarm 2 (or A2)”, and “Inert”. The
∆
safety/tolerance margin on each side (i.e.
Tm
=
∆
in Figure 1) of the “0” reference controls the
region’s effect on the SDITPM operation. The
physical meaning of
2
},0{ ∆ for the
dt
dQ
secondary metric above (i.e.
2,3
SM ) is
""
DD
ref
∆
±
, where
D
ref
=
"0"
and
D
∆
=∆
for
the “D or derivative” control. If the D control in the
th
i cycle (i.e.
i
D ) is beyond the
D
∆± region, the
deviation error
i
dl
,
ψ
(e.g. for
2,3
SM ) assumes
either the “
)(
2,3 DDi
i
refD ∆+−=
ψ
” or the
“
)(
2,3 DDi
refD
∆
−
−
=
ψ
” value.
D
∆
and
P
∆
mark the D and P thresholds (i.e. “Threshold1” and
Threshold2”) respectively as shown in Figure 1. The
generic
i
dl ,
ψ
representation is
dl ,
ψ
, with
th
i cycle
implied. The combined effect by P, D and I elements
for region
r
is the region’s quantified transfer
probability or
r
TP . The overall system transfer
probability is
O
TP , which assumes the
r
TP value
of the current region of operation. Meanwhile the
r
TP values of the dormant regions are reset to zero.
The threshold for migration decision in the
“Migrate” or
1
3
C region is
1
3
C
Th (Table 1), which is
applicable irrespective to the number of primary
metrics being leveraged. Different suffices have
specific meanings, for example,
cl
D
,
for D control
at the
th
c
migration decision making cycle by the
transfer policy with the
th
l primary metric.
Figure 1. High-level view of the SDITPM model
(single primary parameter)
A NOVEL TRANSFER POLICY MODEL TO ENHANCE THE SERVICEABILITY OF AN E-BUSINESS
161
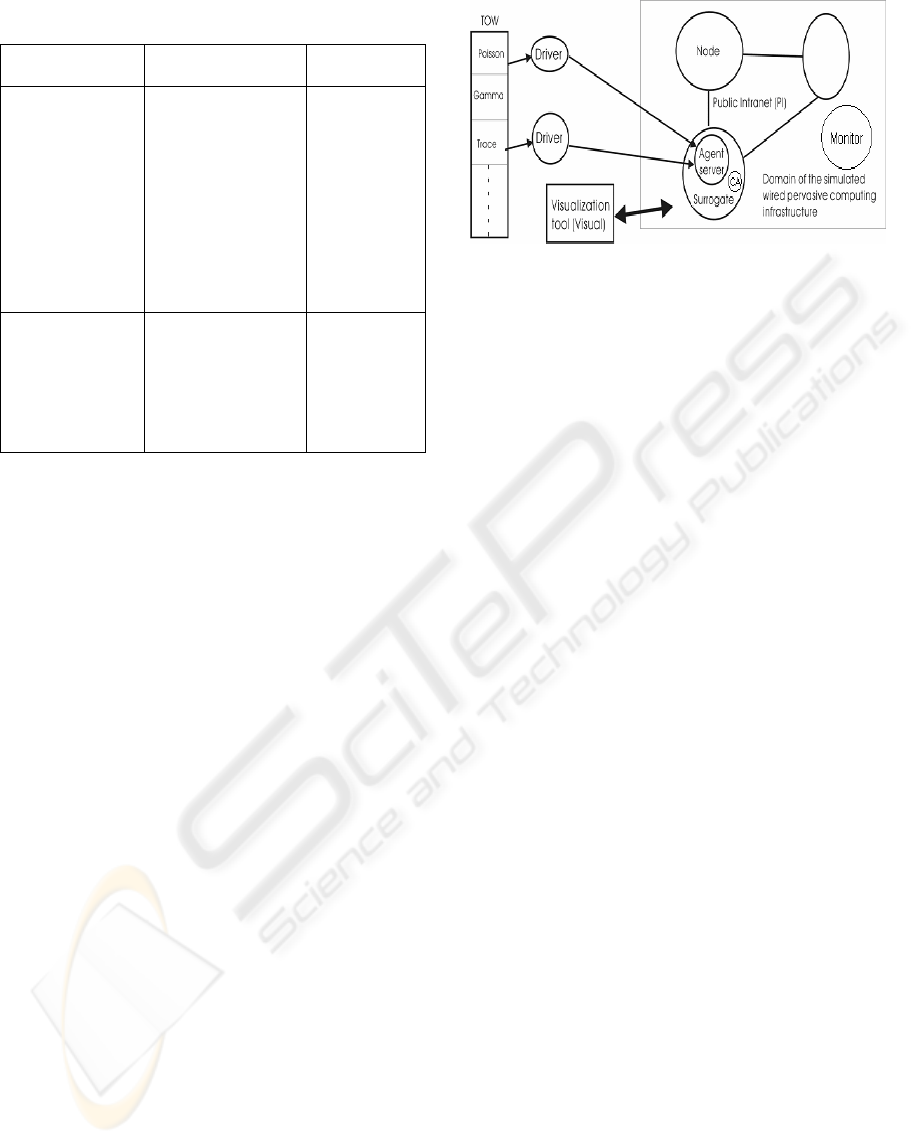
Table 1. Transfer decision matrix for Figure 1
(single control plane,
1=l )
C1 (P control,
positive)
C2(P control,
negative)
C3(D control,
positive)
(
1
3
C
Th ,
1
4
C
Th
and
2
3
C
Th
are
thresholds set
for 3 different
regions)
Migrate for sure
for a single
primary metric;
1
3
Cr
TP
=
is set to
infinity;
1
3
1
3
CCr
ThTP >>
=
always holds
(PID control
region)
Alarm 1
(A1): for
2
3
1
4
C
C
l
ThTP <
else migrate
(region
2
3
C ,
D+I control
only)
C4 (D control,
negative)
Alarm 2 (A2): for
1
4
1
4
C
C
l
ThTP <
, else
migrate
(region
1
4
C , P+1
control only)
Don’t care
or Inert state
(no action
region
2
4
C )
3 EXPERIMENTS
The simulation experiments to verify the SDITPM
are carried out in the Java Aglets mobile agent
environment. This platform is chosen because: a) it
is stable, b) it has rich user experience, c) it supports
agent mobility and d) it is designed for the Internet
and this makes the experimental results scalable to
the real Internet environment. The domain for the
simulated PCI is a part of the PolyU Intranet
annexed by the PI technique (Wong, 2000). Within
the PI the agents migrate freely, and the driver(s),
the agent(s), the CA entity, and the Monitor (Figure
2) are all aglets (agile applets). The driver and the
agent server interact in a client/server relationship.
From the TOW (table of waveforms in Figure 2) the
driver(s) picks a waveform or trace, which embeds
an unknown pattern, to simulate a primary metric. In
Figure 2 two primary metrics are leveraged. The
migration behavior of the agent is recorded in a real-
time fashion by the Visual visualization tool (Wong,
2000). The CA exists as an API so that an agent can
invoke it for computing any waveform means
quickly and accurately, for example, the mean
queuing time
Queuing
Mean . These mean values by
the CA, which is invoked by an agent, are the
“interior” ones in the SDITPM context.
The Monitor that gathers the PI/PCI domain
statistics also invokes its own CA to calculate
different mean values on the fly. In contrast, these
are the “exterior mean values”.
Figure 2. Setup for the SDITPM experiments
The interior and exterior mean values contribute
to the
CI
Threshold computation for evaluating the
“
TP
C
O
ThresholdTP > AND
CI
C
O
ThresholdCI << ” condition for a possible
transfer policy migration. Many experiments were
conducted with the Java SDITPM prototype
leveraging different simulated primary metrics. The
preliminary results indicate that the SDITPM is
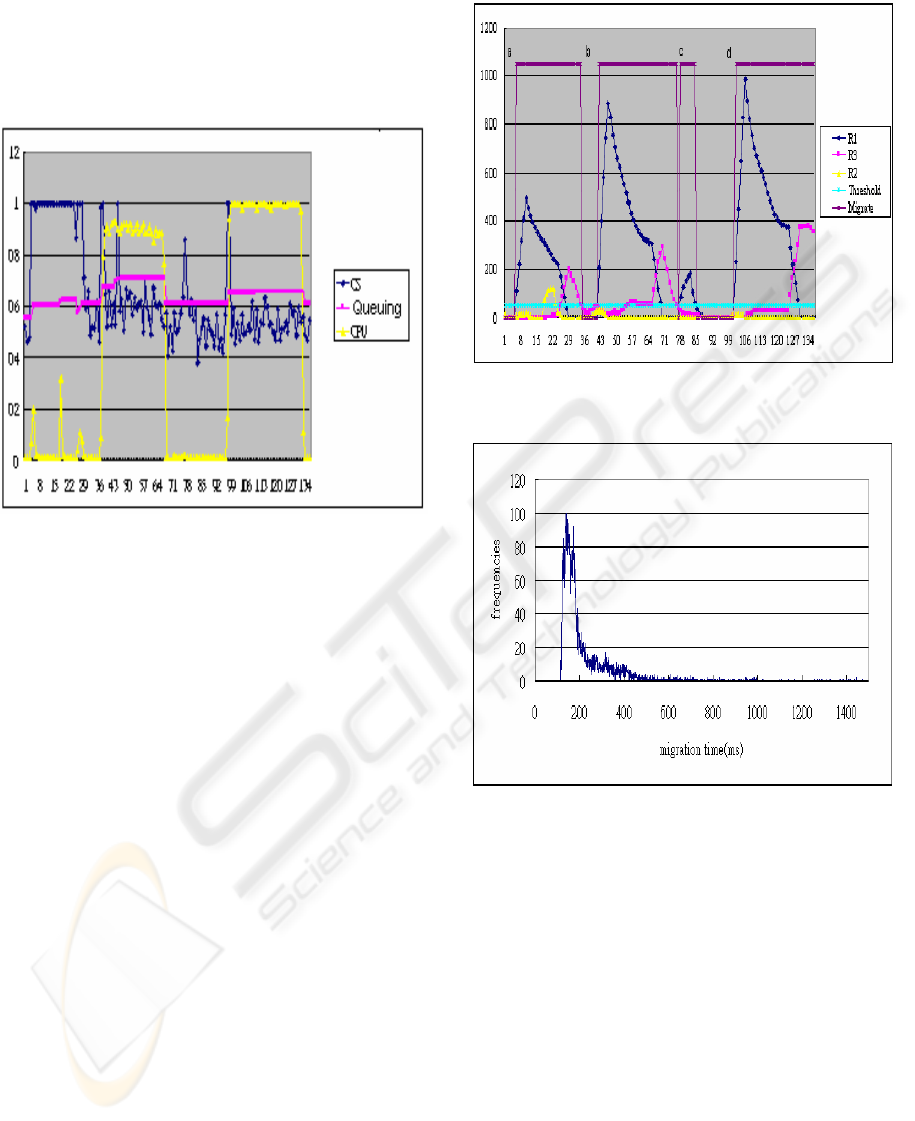
indeed responsive for W&W applications. Figure 3
shows the changes of the three primary metrics
being leverage by SDITPM in the experiment:
context switching (CS) cycle time, queuing time
(Queuing), and agent’s service time (CPU). These
metrics represent a stack of three (
3=N ) control
planes and therefore incidental integration is
required for the
c
r
TP
computation. Figure 4 shows
the regional changes in SDIPM over time.
In this particular experiment one threshold is
assumed for all the control regions for simplicity as
shown in Figure 4. The rectangular pulse in Figure 4
is not a part of the SDITPM behaviour but explains
what happens with respect to time. At the rising
edge “a” SDITPM makes the decision to migrate
and the agent server moves to another PCI/PI node.
This decision is based on the transfer probability
1
3
C
TP of region R1 or
1
3
C
for PID control;
1
3
C
TP exceeds the given threshold. The agent
migrates at the rising edges “b”, “c”, and “d”. The
contributing factor for the subsequent migrations is
also
1
3
C
TP
. It shows inside the rectangular pulse
width how the dominance of one control region is
taken over by another. If the agent had not migrated,
it would have seen these changes. For example,
inside the pulse width between “a” and “b” rising
edges the
1
3
C
TP and
2
4
C
TP transfer probability
distributions for the R1 and R2 (
2
4
C for “D+I”
ICETE 2005 - WIRELESS COMMUNICATION SYSTEMS AND NETWORKS
162
control) regions respectively overlap in the period
“from 17 to 25”. The dominance of
1
3
C
TP for PID
control wanes as time progresses, and at the time
point “26” it is taken over by region R3 or
1
4
C that
administers “P+I” control only.
Figure 3. Changes of three primary metrics over
time
Figure 5 shows the distribution of the agent’s
migration times from one node to another captured
by Monitor. In fact, this is the migration cost
distribution (MCD) for the “whole life” of the PCI
for the duration of the experiment. The CA indicates
the following:
Life
MCD
Mean is 214 .69 ms, the mode is
140 ms (typical migration time), and standard
deviation is 139.5ms. The migration decisions for
the rising edges a, b, c and d in Figure 4 is triggered
by the “true state” of: “
TP
C
O
ThresholdTP >
AND
CI
C
O
ThresholdCI <<
”, where
C
O
CI in this
case was pre-planned to take the
Life
MCD
Mean
(i.e.
214 .69 ms) for testing and demonstration purposes.
Figure 4. Changes in SDITPM’s four control regions
over time with respect to Figure 3
Figure 5. Migration time distribution captured by the
Monitor
.
4 CONCLUSION
The novel statistical distribution independent
transfer policy model (SDITPM) is proposed in this
paper to improve the serviceability of a logical
server agent in a pervasive W&W environment.
Serviceability is the “chance of obtaining a required
service within a defined period”. The preliminary
experimental results indicate that the SDITPM can
indeed helps agents to make responsive transfer
decisions to migrate by leveraging different primary
metrics. As a result the agent server’s serviceability
is improved through mobility. From the leveraged
primary metrics the secondary ones are derived for
A NOVEL TRANSFER POLICY MODEL TO ENHANCE THE SERVICEABILITY OF AN E-BUSINESS
163

the proportional (P), derivative (D), and integral (I)
control elements. These elements are timely
combined by planar and vertical integrations to form
the final transfer probability that effectively affirms
a migration decision. The SDITPM is basically a
PID controller that facilitates the transfer policy
decision making process of an agent server in a
pervasive W&W environment.
ACKNOWLEDGEMENT
The authors thank the Hong Kong PolyU for funding
the research with HJZ91 and “01901531R” support.
REFERENCES
A. Avizienis, J.-C. Laprie, B. Randell and C. Landwehr,
Basic Concepts and Taxonomy of Dependable and
Secure Computing, IEEE Transactions on Dependable
and Secure Computing, 1(1), January-March 2004, 11-
33
G. Coulouris et al, Distributed Systems – Concepts and
Design, 3
rd
Edition, Pearson, 2001
W.T. Cockyane and M. Zyda, Mobile Agents, Manning,
1997
Allan K.Y. Wong, Wilfred W.K. Lin and Tharam S.
Dillon, Local Compilation: A Novel Paradigm for
Multilanguage-Based and Reliable Distributed
Computing over the Internet, Special Issue: Mobile &
Wireless Communications & Information Processing,
in the Journal of Simulation, 75(1), July 2000
Allan K.Y. Wong and Joseph H.C. Wong, A Convergence
Algorithm for Enhancing the Performance of
Distributed Applications Running on Sizeable
Networks, The International Journal of Computer
Systems, Science & Engineering, vol. 16, no. 4, July
2001, 229-236
ICETE 2005 - WIRELESS COMMUNICATION SYSTEMS AND NETWORKS
164
