
A WEB-BASED ALGORITHM ANALYSIS TOOL
An Online Laboratory for Conducting Sorting Experiments
James TenEyck
Department of Computer Science, Marist College, Poughkeepsie, NY, USA
Keywords: Sorting algorithms, Algorithm analysis, Asymptotic behavior of algorithms, Big-oh notation.
Abstract: In this paper, an on-line laboratory is described in which students can test theoretical analyses of the run-
time efficiency of common sorting algorithms. The laboratory contains an applet that allows students to
select an algorithm with a type of data distribution and sample size and view the number of compares
required to sort a particular instance of that selection. It provides worksheets for tabulating the results of a
sequence of experiments and for entering qualitative and quantitative observations about the results. It also
contains a second applet that directly measures the goodness of fit of recorded data with common functions
such as cn
2
and cn(lg(n)). The laboratory is intended to reinforce classroom learning activities and other
homework assignments with a practical demonstration of the performance of a variety of sorting algorithms
on different kinds of data sets. It is a singular on-line tool that complements other online learning tools such
as animations of various sorting algorithms and visualizations of self-adjusting data structures. The
laboratory has been used in algorithms courses taught by the author at Marist College and Vassar, and is
available on-line for use by a more general audience.
1 INTRODUCTION
Algorithm analysis is a particularly difficult concept
for many computer science students to learn.
Despite the fact that students are taught to analyze
the run-time efficiency of algorithms using big-oh
notation early in their course of study, many upper-
level students are uncomfortable using this analysis
tool. Many students find the study of algorithm
analysis to be too abstract and consider it to be not
particularly relevant to their prospective career.
Students often state that when they need to find an
efficient algorithm to apply to a particular problem,
they can find one in a book or on the web, even
though, without the appropriate analytical skills,
they are relying more on the authority of their source
than on their own assessment.
This sorting laboratory attempts to make the
study of algorithm analysis more concrete by
providing students with a hands-on experience of
comparing the observed run-time behavior of
various sorting algorithms with results obtained
from analysis of asymptotic behavior. It also
requires the students to evaluate how the various
algorithms perform upon varying data sets.
Sorting algorithms are well suited for an
algorithm analysis laboratory. They are familiar to
students and provide a good basis for comparing
alternative approaches. Sorting algorithms are
among the first algorithmic procedures that students
encounter in their course of study, and by the time
they are ready to take a class in Algorithm Analysis
and Design; they are usually familiar with several
alternative approaches that they can choose from to
perform a sort. With a number of different
algorithms that can be used to sort the same initial
data set, a comparison of the relative performance of
each is easily made. Students are able to observe for
themselves that choosing an appropriate sorting
algorithm for a particular application is not strictly
pre-determined, but requires an analysis of the data
set to be sorted and a familiarity with the strengths
and weaknesses of the various algorithmic
approaches. With this laboratory experience
accompanying classroom instruction and other
homework assignments, the student should obtain a
more comprehensive appreciation of sorting
algorithms.
2 COMPARISON WITH OTHER
AVAILABLE TOOLS
The sorting laboratory is different from most of the
other on-line material augmenting courses in
Algorithms in that it deals with the analysis rather
485
TenEyck J. (2005).
A WEB-BASED ALGORITHM ANALYSIS TOOL - An Online Laboratory for Conducting Sorting Experiments.
In Proceedings of the First International Conference on Web Information Systems and Technologies, pages 485-489
DOI: 10.5220/0001233304850489
Copyright
c
SciTePress
than the step-by-step display of the workings of an
algorithm. Animation tools are readily located on
the web by performing a search using algorithm
animation or sorting algorithms as a key. Analysis
tools on the web are far scarcer, and it requires a
much deeper traversal of the list of possible matches
to find anything similar to this laboratory.
The most similar tool to the laboratory described
here is one produced by Carol Wellington at
Shippensburg University (Wellington, 1998). It also
focuses on sorting algorithms. It allows the user to
select a sorting algorithm, a data set and a sample
size, and it combines an animation with a report of
the number of compares and swaps that were
executed. It encourages the user to perform an
analysis of the results, but it does not produce a
worksheet to assist in that effort.
Another prominent example of an algorithm
analysis tool is the KLYDE workbench developed at
DePauw University (Berque, 1994). It is one in a
line of locally implemented laboratories (Collins,
1991; Baldwin, 1992; Epp, 1992) developed at the
time in response to the Computing Curricula 1991
Report of the ACM/IEEE Joint Curriculum Task
Force (Tucker, 1990) that recommended
experiences involving experimentation should be
included in the undergraduate computer science
curriculum. The original KLYDE system was
developed in Turbo Pascal to run under DOS on the
x86 based platforms of the time. It supported a
varied collection of algorithms, and used execution
time as the metric for evaluating performance.
KLYDE is not an on-line tool, but is available from
the developers.
The intent of the sorting laboratory described in
this paper differs from the two previously cited in
several important ways:
• Its only focus is analysis. It does not do
animations. Animations are useful for
explicating the algorithmic approach and links
to other animation sites are provided on the
initial page, but this tool uses larger sample
sizes that would make animation impractical.
• It reinforces the teaching of asymptotic analysis.
The laboratory experience allows the student to
compare empirical results with the worst-case
asymptotic bounds developed in class. The
algorithms are implemented essentially as they
appear in the standard text, and are not specially
modified to enhance their execution speed. The
metrics used here are comparison and swap
counts, as is the case in the classroom
discussion.
• The applets and all of the supplementary
material for performing experiments are
available online..
3 DESCRIPTION OF THE SORTING
LABORATORY
The laboratory consists of an initial html page with
links to the various resources it provides. The
laboratory has two main components. The first is an
applet in which the student may repeatedly select a
sorting algorithm, a sample size and a data set, and
read from the display the number of comparisons
and swaps needed to perform the sort. At present
the choice of algorithms consists of insertion sort,
selection sort, bubble sort, quicksort, and mergesort.
The data sets include randomly generated integers,
highly degenerate data, almost sorted data, and
reverse ordered integer values; and the sample sizes
are all the even powers of two from 16 to 4096. A
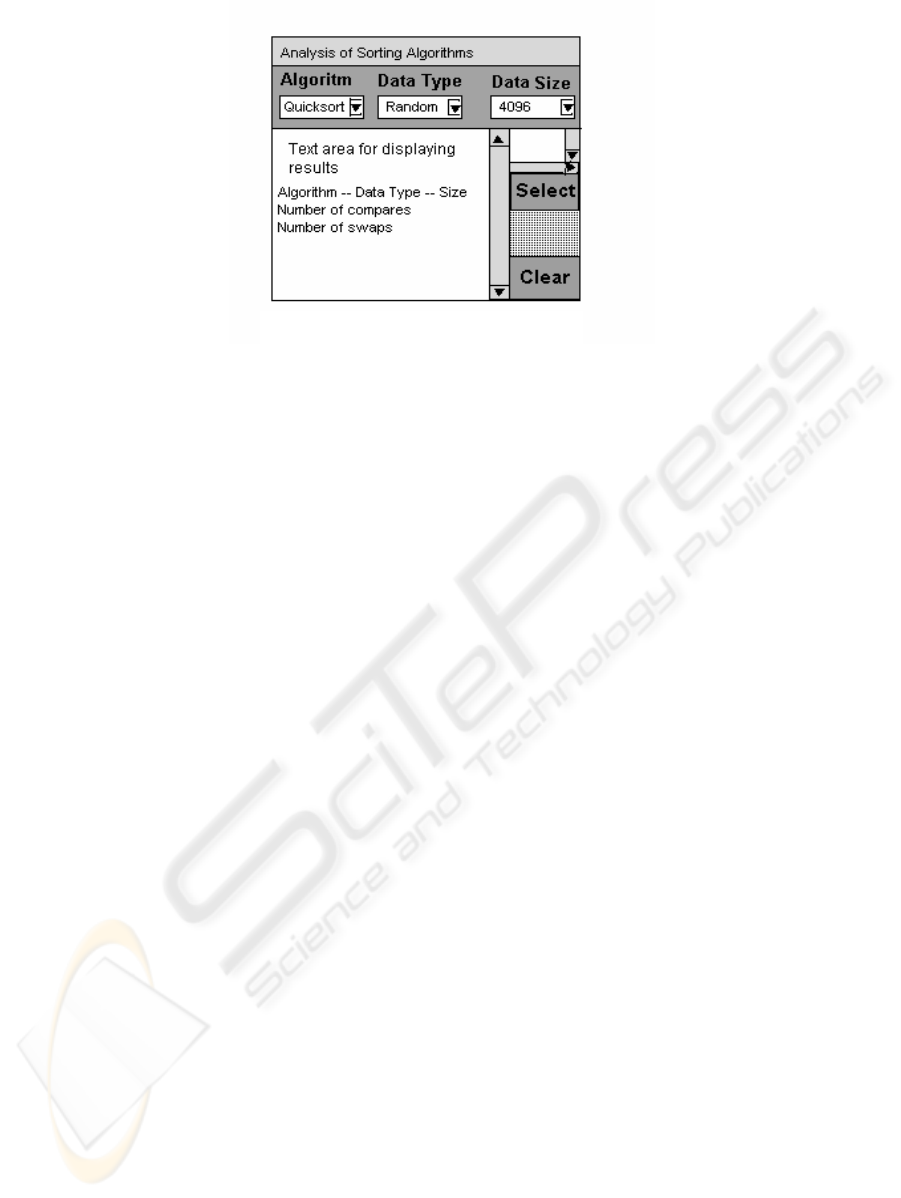
Figure 1: User Interface for Main Applet
WEBIST 2005 - E-LEARNING
486

depiction of the applet’s interface is shown in Figure
1 on the previous page.
In performing an experiment, the student selects
an algorithm, a data type, and a sample size from the
three JList objects located beneath their respective
labels. When a selection has been made, the student
clicks on the Select button in the panel at the right of
the screen, and an output string is appended to the
text area at the bottom-left (center) of the display.
The output indicates the algorithm selected, the type
of data set operated upon, the sample size chosen,
and the number of compares and swaps that were
counted during the run. The applet appends the
output string from each new selection to the contents
of the text area. The text area can be cleared at any
time by the student clicking on the Clear button at
the bottom of the panel at the right of the screen.
This panel also contains a small text area above the
Select button containing the instructions for the user.
The student may obtain downloadable
worksheets for recording data and making
qualitative and quantitative observations about that
data by clicking on one of the other primary links on
the first page. The worksheet provides boxes for
entering data and lines for student responses to
questions about the performance of the various
algorithms on each of the different data sets. The
worksheet also provides the values of n
2
and n lg(n)
for each of the sample sizes in one of the questions
and contains instructions for how to compare the
recorded data points with a multiple of either of
these two common functions. The laboratory does
not presently provide its own graphing tool, but the
worksheet provides instructions to the students on
how to use the graphing facility in Excel to visualize
comparisons between different algorithmic
approaches and between curves generated from the
data and plots of the two standard functions.
However, because there is such a wide disparity
between the range of sample sizes and the range of
comparison counts, the difference in scale between
the horizontal and vertical axes distorts the shape of
the curves and makes visual recognition of the
algorithmic behavior less transparent.
The second component directly measures the
goodness of fit of the generated data points to the
functions n
2
and n lg(n) and automatically generates
the parameters of the best fitting curve. The selected
algorithm is run over a range of sample sizes of
randomly generated data, and the best-fitting curve
for the resulting data points is determined. In this
approach, data points for ten different sample sizes
are obtained. These samples sizes range from 400 to
4000 and for each sample size the average of five
runs is used to determine the number of
comparisons. Curvilinear regression is used to
determine a best fit to one of the two standard
curves, and the parameters of this curve are
appended to an output string (Miller, 1965).
In figure 2, the interface for this second applet is
displayed. The general features are consistent with
those of the first applet. The student using this
applet need only select the sorting algorithm and the
program will run multiple sorts, collecting the data
points to be used in the regression analysis. When
the program completes, the parameters of the best
fitting curve are appended to the output string and
displayed in the text area at the bottom of the applet.
The average number of compares and the predicted
number for each sample size are copied into the
table located in the center of the applet. The only
data set type is the randomly generated distinct
integers, and the sample sizes are pre-set.
This second component eliminates the role of the
student in recording observations and evaluating the
data that he or she has collected. It effectively
automates out the traditional role of the
experimenter. Its principal value is that it provides
an immediate comparison between the average case
performance of the algorithm with the worst-case
performance (in the case of quicksort, the average
case performance) predicted by big-oh analysis. It
can also be used by the student to quickly check the
reasonableness of the results obtained from doing his
or her own calculations on random data sets.
Figure 2: User Interface for the Second Applet
A WEB-BASED ALGORITHM ANALYSIS TOOL - An Online Laboratory for Conducting Sorting Experiments
487

4 INTEGRATION OF THE
LABORATORY INTO THE
CURRICULUM
In the Algorithm Analysis and Design course in
which the sorting laboratory has been used, it has
been integrated into a learning module with the
following objectives:
• Reinforce the student’s grasp of algorithm
analysis.
• Develop the student’s appreciation of the
strengths and weaknesses of the various sorting
algorithms.
• Provide a learning experience in which the
student applies the knowledge acquired through
the classroom and laboratory activities to a new
situation.
The study of sorting algorithms directly follows
a unit on asymptotic analysis and solving recurrence
relations. The laboratory activity is assigned after
an initial lecture that emphasizes the design of
iterative algorithms using loop invariants and a
homework assignment that includes implementing
insertion sort and quicksort, clearly stating and
adhering to appropriate loop invariants.
At the completion of the unit the students are
asked to write a program that will efficiently sort a
suite of data sets supplied by the instructor. They
are not told the exact composition of this suite but
they do know that each of the data set types they
encountered in the sorting laboratory are represented
to one extent or another. They are in competition
with each other to either select the algorithm with
the best overall performance or produce an efficient
hybrid that uses a different algorithm for large and
small segments of the data. The student algorithms
are incorporated into a benchmark program provided
by the instructor and run on a common platform on
the common suite of data sets. The algorithm that
realizes the best performance "wins" the
competition, and the student that submitted it
receives bonus points that are added directly to his
or her final grade-point average.
At this writing there is only a qualitative
judgment that the laboratory experience augmented
by the programming competition has enhanced the
learning experience of the students. They seem to
enjoy the exercise and have a better on-time
completion percentage than they achieve on other
assignments.
5 EVOLUTION OF THE SORTING
LABORATORY
This laboratory evolved from an activity that was
created to give visiting high school students a taste
of an aspect of computer science. It was one of a
number of activities designed to be fun as well as
educational. The initial activity ran as a standalone
menu-driven Pascal program and required the
students to tabulate the results of the sorts and
answer some qualitative questions.
A number of years after this event, the program
was rewritten as a java applet with a GUI interface
and incorporated into an expanded laboratory
exercise for students in an Algorithm Analysis and
Design class. The applet directly displaying the
parameters of the least squares best-fit curve to a
standard function was added recently.
The plan for the near future is to add shellsort
and heapsort to the set of algorithms, and replace the
too small text area displaying user instructions with
a pop-up message dialog box. With shellsort, the
student will have an additional option of selecting
the step size. A more long-range objective is to
augment the printable worksheet with an interactive
spreadsheet. The goal is to remove as much of the
routine drudgery in the calculations as possible with
the student retaining control over which calculations
to perform. Ultimately the sorting laboratory serves
as a model for an algorithm analysis laboratory
encompassing other kinds of algorithms.
6 CONCLUSIONS
A search of the internet has revealed few similar
online tools for evaluating the performance of
algorithms. Several of the more frequently
referenced animations of sorting algorithms indicate
the sample size and number of comparisons and
swaps in performing the sort, but they do not attempt
to evaluate performance on a range of sample sizes.
This laboratory is a contribution to a niche of online
learning tools that has yet to be adequately filled.
The laboratory for analysis of sorting algorithms
described in this paper enhances student learning in
the following ways:
• It is easy to use and provides a rather enjoyable
learning experience.
• It provides concrete examples of the run-time
behavior of the various algorithms on a variety
of data set types.
• It uses the scientific method of collecting and
analyzing data and using the results to test
hypotheses. It provides a worksheet with a set
WEBIST 2005 - E-LEARNING
488

of questions that require students to observe and
write out salient features of the performance of
the algorithms on the different data sets.
• It augments other learning activities in the unit
teaching about the design, implementation, and
analysis of performance of sorting algorithms.
This tool has been used several times by the
author in courses in the analysis of algorithms.
While no quantitative measure of the benefit it
provides has been attempted, the qualitative
observations of the benefit include greater student
interest and more timely completion of assignments.
The sorting laboratory is available online for use by
the academic community at the web site listed
below.
www.academic.marist.edu/~jzbv/algorithms/sorts
REFERENCES
Berque, D., Bogda, J., Fisher, B., Harrison, T., and Rahn,
N., 1994. The KLYDE Workbench for Studying
Experimental Algorithm Analysis. Proceedings of the
Twenty-fifth SIGSCE Symposium on Computer
Science Education, pp 83-87. Pheonix, AZ.
Collins, W., 1991. Estimating Execution Times: A
Laboratory Exercise for CS2. SIGSCE Bulletin, pp
358-363, Vol23, No. 1, March 1991.
Epp, E., 1992. Yet Another Analysis of Algorithms
Laboratory. SIGSCE Bulletin, pp 11-14, Vol. 24, No.
4, December 1992.
Miller, I. and Freund, J. E., 1965. Probability and
Statistics for Engineers, Prentice-Hall.
Tucker, A. (editor), 1990. Computing Curricula 1991:
Report of the ACM/IEEE-CS Joint Task Force. IEEE
Computer Society Press.
Wellington, C. http://www.ship.edu/~cawell/Sorting/
A WEB-BASED ALGORITHM ANALYSIS TOOL - An Online Laboratory for Conducting Sorting Experiments
489
