
PERFORMANCE ANALYSIS OF WEB SERVERS
Apache and Microsoft IIS
Andrew J. Kornecki, Nick Brixius
Embry Riddle Aeronautical University, Daytona Beach, FL 32114
Ozeas Vieira Santana Filho
Senac University Center, Sao Paulo, Brasil, CEP 01222-903
Keywords: Internet Services, Web Servers, Performance Analysis
Abstract: The Internet has become the leading means for people to get information and interact between
organizations. Each year there is an increase of the numbers of Internet users. Organizations must be aware
of the performance of their web servers to be able to accommodate this growing demand. Networks,
connections, hardware, web servers and operating systems each have a role to play in this market, but the
web server could be a bottleneck for the entire system. The goal of this research paper is to discuss the
issues related to the performance analysis of web servers. The focus is on measurement technique as a
solution to performance analysis. Also, the paper describes a practical method to compare two web servers.
1 INTRODUCTION
The World-Wide Web is one of the most used
services of the Internet. Basically, the World-Wide
Web is a client/server system that integrates diverse
types of information on the global Internet and/or
enterprise networks. Clients and servers on the Web
communicate using the HyperText Transfer Protocol
(HTTP), which is layered on the TCP/IP protocol. In
this client/server system, the client is a Web
Browser, such as Internet Explorer or any software
that can make a HTTP request for a HTML
(HyperText Markup Language) file and is able to
show it graphically to the user. The Web Server
software manages all the web server site files and
responds to all requests made by web browsers.
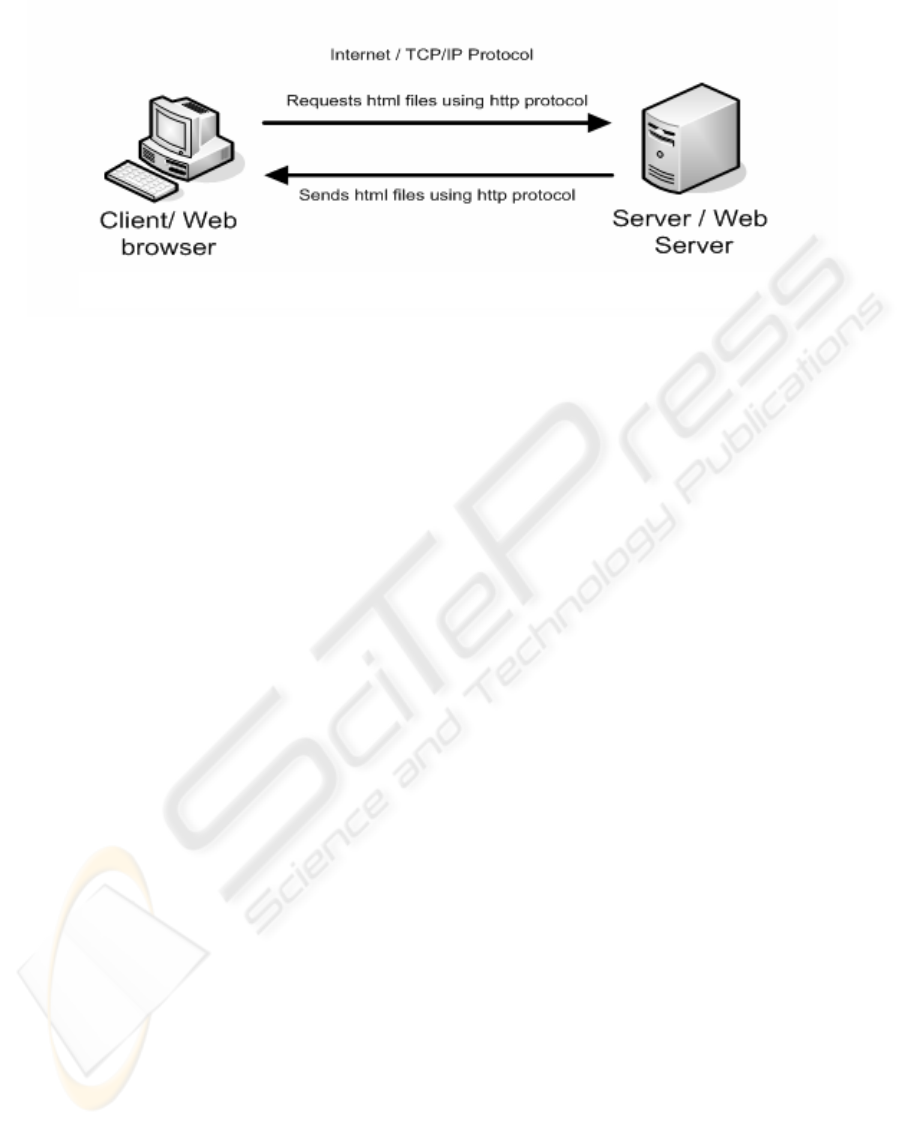
Figure 1 shows a simplified one to one
client/server environment for HTTP communication.
In the real Internet, the connections are n-to-n, and
servers can connect to other servers using Web
services protocols. Also clients can connect directly
with others clients, as a peer-to-peer network, to
exchange files or for other types of data
communication. Figure 1, however, represents the
client/server HTTP communication, that it is the
focus of this study.
Most studies of Web server performance consider
only static Web content. A dedicated tool, httperf,
for measuring HTTP performance and generating
the client workload, was presented in (Titchkosky,
2003). That paper compared performance of various
web servers. However, the Internet Information
Server, one of the most used in the market, was not
part of the testing suite. Several other papers
(Prefect, 1996), (Banga, 1999), (Hu, 1999),
(Barford, 2001) discuss measurement of web server
performance.
The Standard Performance Evaluation
Corporation (SPEC) is a non-profit corporation
formed to establish, maintain and endorse a
standardized set of relevant website benchmarks
(SPECweb99, 1999). There are a great number of
results using these benchmarks that can be accessed
on SPEC site (www.spec.org).
The objective of this project is to compare the
performance of two widely used web servers
available on the market. The specific goal of the
experiment is to compare performance of two
systems using the same platform, hardware and
operating system. The component under study is the
web server: either Apache Web Server or the
Microsoft Internet Information Server. Data will be
collected, and statistics and performance analysis
techniques will be used to create this report.
293
J. Kornecki A., Brixius N. and Vieira Santana Filho O. (2005).
PERFORMANCE ANALYSIS OF WEB SERVERS - Apache and Microsoft IIS.
In Proceedings of the First International Conference on Web Information Systems and Technologies, pages 293-298
DOI: 10.5220/0001231102930298
Copyright
c
SciTePress
2 TEST ENVIRONMENT
The system under test (SUT) consists of the Web
Server and Web Browser. Two other components
playing roles in the experiment are the operating
system and the software that will collect the metrics.
Since the tool selected to get the metrics also plays
the role of a client through making requests to the
server, a Web Browser is not necessary in the test.
The operating system is Windows 2003 Enterprise
Server, which was the latest release from the
Microsoft at the time of the experiment.
To assure that the SUT will not interfere with any
other software installed, and also to provide more
controlled environment, the Microsoft Virtual PC
has been used to create a virtual machine to run the
tests. Due to comparative nature of the study the
description of hardware environment is not critical.
For the record, the experiment was run on a
conventional computer (Pentium IV, 2.4Ghz,
768MB, Windows XP SP1 and 60GB hard disk).
The Microsoft Virtual PC runs: (a) the Microsoft
Windows 2003 Server, (b) the Webbench,
performance web tool for collecting data, and one of
the Web Servers at a time: either (c1) Microsoft
Internet Information Server 6.0 or the (c2) Apache
HTTP Server Version 2.0.51.
The next sections describe the components of the
SUT.
2.1 Apache HTTP Server V.2.0.51
The Apache project is an effort to develop and
maintain an open-source HTTP server for various
modern desktop and server operating systems, such
as UNIX and Windows. The goal of this project is to
provide a secure, efficient and extensible server
which provides HTTP services in synchronization
with the current HTTP standards. Apache is
available at http://httpd.apache.org/
Apache has been the most popular web server on
the Internet since April of 1996. The Netcraft Web
Server Survey of October 2004 found that more than
67% of the web sites on the Internet are using
Apache, thus making it more widely used than all
other web servers combined. The Microsoft IIS
holds over 21% of the web server market share.
2.2 Microsoft Internet Information
Server 6.0
Internet Information Services (IIS) is a part of the
Microsoft® Windows® Server 2003 family and
attempts to provide an integrated, reliable, scalable,
secure, and manageable Web server. The IIS is a
tool for creating a communications platform of
dynamic network applications. IIS 6.0 leverages the
latest Web standards like Microsoft ASP.NET,
XML, and Simple Object Access Protocol (SOAP)
for the development, implementation, and
management of Web applications. IIS 6.0 includes
new features designed to help Web administrators
improve performance, reliability, scalability, and
security either on a single IIS server or on multiple
servers.
The IIS 6.0 is integrated with the Windows 2003
Server Family. Windows Server 2003 includes
functionality customers may need today from a
Windows server operating system, such as security,
reliability, availability, and scalability. In addition,
Microsoft has improved and extended the Windows
Server operating system to incorporate the benefits
of Microsoft .NET for connecting information,
people, systems, and devices. The Microsoft®
Windows® Server is a retail Microsoft product.
2.3 Microsoft Virtual PC 2004
The focus of the study was to compare performance
of selected servers rather than assess specific
Figure 1: Simplified Client/Server of HTTP communication.
WEBIST 2005 - WEB INTERFACES AND APPLICATIONS
294
performance of each. Virtual environments impact
each server in the same way and are thus appropriate
for this comparison. With Microsoft® Virtual PC
2004, it is possible to create one or more virtual
machines, each running its own operating system, on
a single physical computer. The virtual machine
emulates a standard x86-based computer, including
all the basic hardware components except the
processor. By using emulated hardware and the
processor in the physical computer, each virtual
machine works like a separate physical computer.
Because each virtual machine has its own operating
system, it is possible to run several different
operating systems at the same time on a single
computer. The Microsoft® Virtual PC 2004 is a
retail Microsoft product.
2.4 WebBench 5.0
There are a number of Web server benchmarking
programs available that can be used to obtain
performance metrics. They differ in their ability to
be configured by the user running the tests. Some
are very flexible, such as the Webbench, Webstone,
webmonitor or httperf (Almeida, 1997), (Mosberger,
1998), (Nahum, 1999), and others are less flexible,
such as the SPECweb99 that does not even allow the
analyst to change the workload, as it is predefined in
the standard (SPECweb99, 1999).
The WebBench tool, a licensed PC Magazine
benchmark program developed by Veritest, has been
used to collect the data. WebBench uses clients to
send requests to the server for static files placed on
the server or for a combination of static files and
dynamic executables that run producing the data the
server returns to the client. During WebBench's test
suite execution, the clients issue a combination of
requests for static and dynamic data. These clients
simulate Web browsers. When the server replies to a
client request, the client records information, such as
how long the server took and how much data it
returned, and then sends a new request. When the
test ends, WebBench calculates two overall server
scores (number of requests per second and
throughput in bytes per second) as well as individual
client scores. The user can view all these results
from the WebBench controller.
The link to the WebBench Web site is
http://www.veritest.com/benchmarks/ .
3 EXPERIMENT
In this project, the web servers were rated by these
metrics:
• Requests per Second: the total number of
successful requests divided by the amount of time
in seconds that it took for the requests to
complete.
• Throughput: how many bytes per second the
server is providing to the clients.
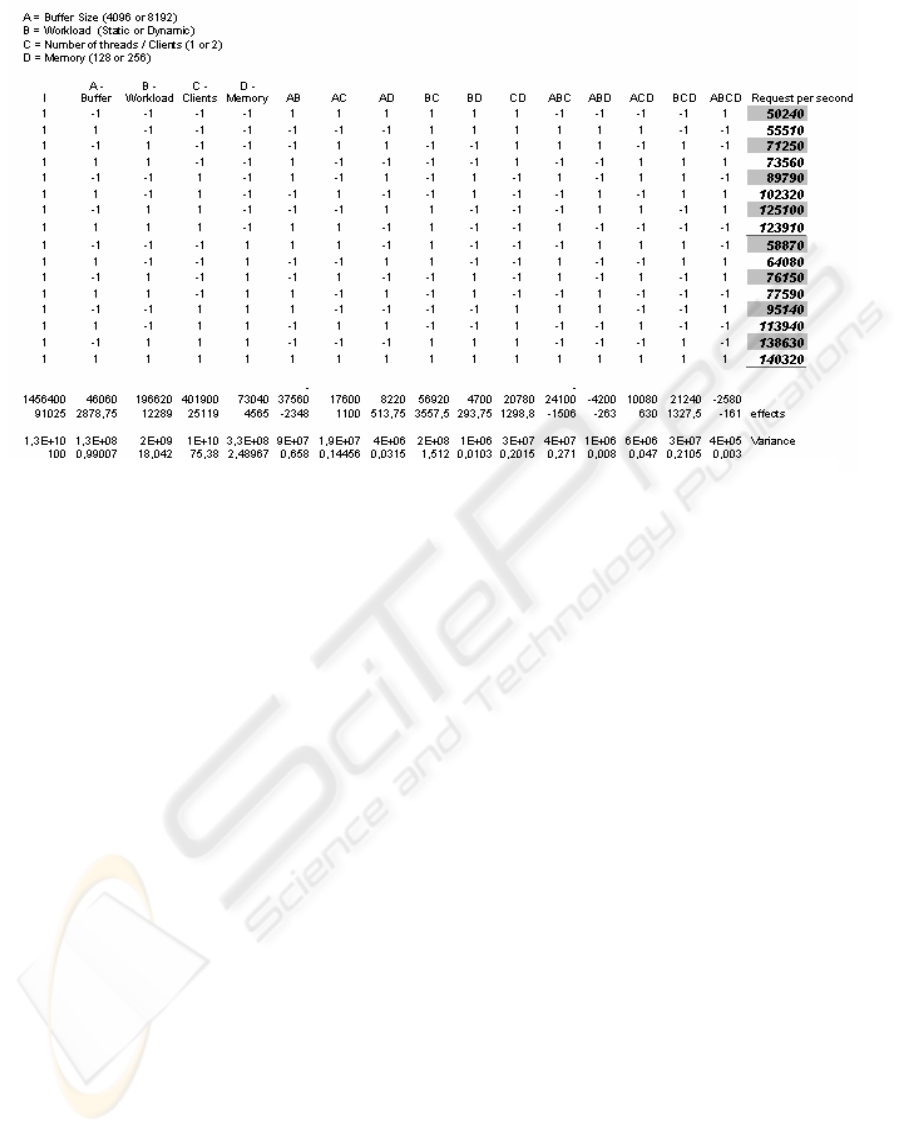
It is necessary to identify factors that have an impact
on the performance of web servers. Each factor can
Figure 2: Table with detailed information about the 2
k
experimental design.
PERFORMANCE ANALYSIS OF WEB SERVERS: Apache and Microsoft IIS
295
assume multiple values, thus having multiple levels.
Four factors were selected to run a 2
k
factorial
experiment. The objective was to assess the factors
and identify the important ones for doing the
comparison of two web servers. The four factors are:
• Quantity of Memory of the system under
test (128 or 256 MB).
• Number of Clients (Threads) that will make
the requests to the Web Server (1 or 10)
• Receive Buffer Size (4096 or 8192 bytes)
• Workload (Static or Dynamic)
The last factor represents what is considered to be
the system workload. While running a Web server
there are two types of workload:
• Static Web site: Requests for static HTML
pages that contain only html commands and
graphic files. Typically, this load has a low
impact on Web server components. Only
requests for very large files are disk and
network intensive.
• Dynamic Web site: Requests for HTML
pages where the content is dynamically
generated on the server and can have back-
end server interactions. Typically, these
requests are CPU and/or disk intensive.
It is possible to modify or create the workload to
tailor it to be more realistic and resemble a specific
system. But here the tools were used to generate
general workload that simulates the typical scenario
of web requests.
The WebBench allows the analyst to change the
percentages of each type of request. Also, the
dynamic workload is composed of a percentage of
CGI calls and the remaining requests are static.
The experimental design was used to reduce the
amount of effort necessary to collect all the data
(Lilja, 2000). The n2
m
fractional factorial design was
used to find the dominant factors that have the most
impact in the performance (necessary to reduce the
number of experiments). Experiments were
performed for each Web Server to get the metrics:
requests per second and throughput. The mean,
standard deviation and confidence interval of the
resulting experiments were calculated. And finally,
the metrics were compared for the two alternatives.
The above identified steps, factors and workload
constituted a base for the 2
4
experimental designs.
The four factors, with their respective two levels
were:
A = Buffer Size (4096 or 8192)
B = Workload (Static or Dynamic)
C = Number of threads / Clients (1 or 2)
Figure 3: Request/Second for Apache and IIS experiments.
Apache Server - Overall WebBench Requests/Second
0,000
10000,000
20000,000
30000,000
40000,000
50000,000
60000,000
70000,000
80000,000
1
T
S
t
a
t
i
c
1
1
T
S
t
a
t
i
c
2
1TStatic3
1
TDyna
m
ic
1
1
TDyna
mi
c
2
1
T
D
yn
ami
c3
2
T
S
t
a
t
i
c1
2
T
S
t
a
t
i
c2
2
T
S
t
a
t
i
c3
2TDynamic1
2TDynamic2
2
TDyna
m
ic
3
4
TStatic1
4
TSt
a
tic2
4
TSt
a
tic3
4
T
D
yn
ami
c
1
4
T
D
yn
ami
c
2
4
T
Dynamic3
8
T
S
t
a
t
i
c
1
8TStatic2
8TStatic3
8
TDyna
m
ic
1
8
TDyna
mi
c2
8
T
D
yn
ami
c3
16
TS
tati
c1
16
T
Stati
c2
16
T
Stati
c3
16TDynamic1
16TDynamic2
1
6TDynamic
3
32TS
t
a
t
ic1
3
2
TS
tat
ic2
3
2
TS
tat
ic3
32
T
D
yn
ami
c1
32
T
D
yn
amic2
32TDynamic3
Mix Name
Requests / Second
Internet Information Server - Overall WebBench Requests/Second
0,000
20000,000
40000,000
60000,000
80000,000
100000,000
120000,000
140000,000
160000,000
1TS
t
at
i
c1
1TS
t
at
i
c2
1TS
t
at
i
c3
1T
Dynamic1
1TDynamic2
1TDynamic3
2TStatic1
2TStatic2
2TStatic3
2TD
ynam
i
c1
2TD
ynam
i
c2
2TD
ynam
i
c3
4TS
t
at
i
c1
4T
St
at
i
c2
4T
Stati
c3
4TDynamic1
4TDynamic2
4TDyna
m
ic3
8TStatic1
8TStatic2
8TS
t
at
i
c3
8TD
ynam
i
c1
8T
Dynamic2
8T
Dynamic3
16TS
t
at
i
c1
16TS
t
at
i
c2
16TS
t
at
i
c3
16
TDynamic1
16TDynamic2
16TDynamic3
32TStatic1
32TStatic2
32TStat
i
c3
32TD
ynam
i
c1
32TD
ynamic2
32TD
ynamic3
Mix Name
Requests / Second
WEBIST 2005 - WEB INTERFACES AND APPLICATIONS
296
D = Memory (128 or 256 MB)
The reason for using relatively low memory values
was to stress the web server. For instance, there is no
impact on performance of 500MB server while
running it with 2 or 4 GB of memory. Each of the 16
experiments was run for two minutes with data
collected by WebBench. The computed effects of
each factor were:
o Buffer: 1 %
o Workload: 18%
o Number of Clients: 75.5%
o Memory: 2.5%
The effects of factor interactions were very low,
all less than 1%, except the interaction of Workload
and Number of Clients, which was 1.5%. For
example, a table with detailed information on one of
the metrics of the 2
k
experimental design is shown in
Figure 2.
The above results led to using only the Workload
and Number of Clients factors to do the detailed
experiments and to compare the Web Servers.
Twelve experiments were conducted using the
combinations of the two levels of Workload factor
(Static, Dynamic) and six levels for Clients factor (1,
2, 4, 8, 16, and 32). Each experiment was repeated
three times. The total of 36 suites of experiments
were run for 30 seconds for each server in
WebBench. The measurements of requests per
second and throughput for each server were used for
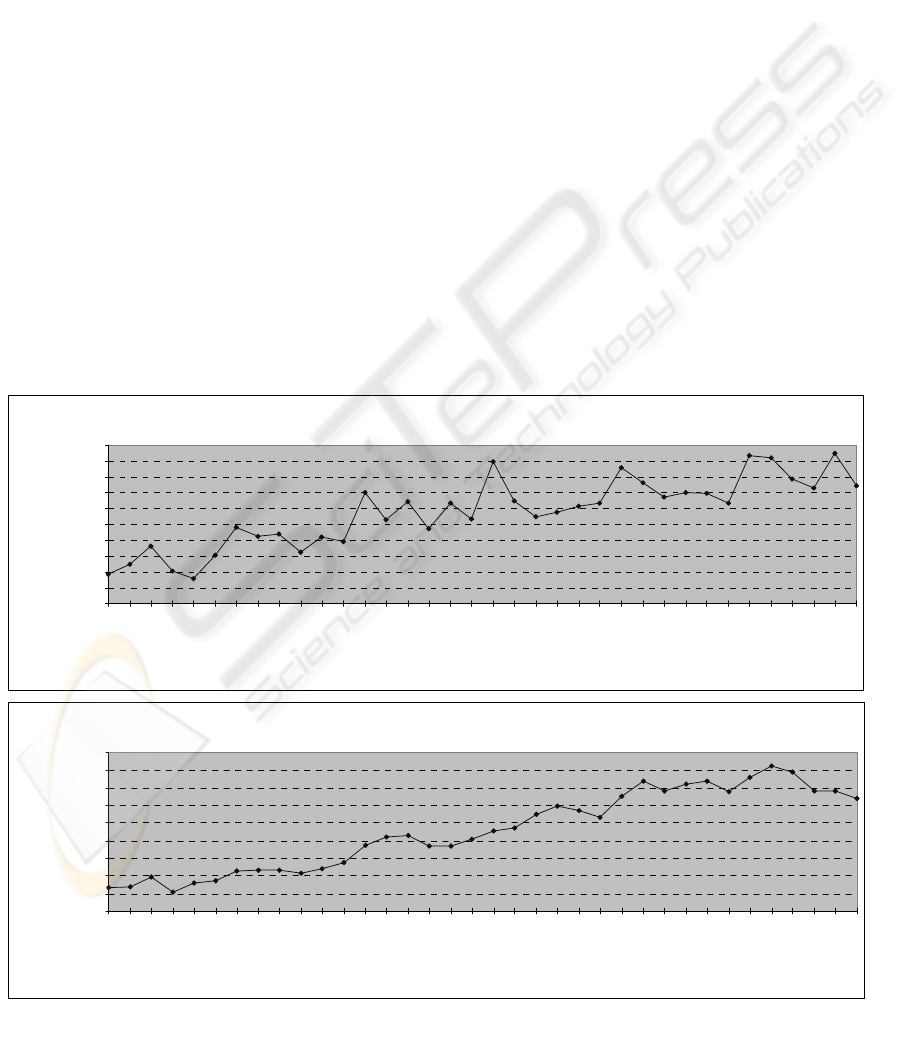
comparison. Figures 3 and 4 show the results.
From the corresponding measurements made on
the two servers, a confidence interval for the mean
of the individual differences was constructed. If the
confidence interval for the differences does not
include zero, then the sign of the mean difference
indicates which system is better. If the confidence
interval includes zero, the difference is not
significant (Lilja, 2000). The results are shown
below.
For the difference of Request per Second metric:
• Difference Mean: 29,559.7
• Difference Standard Deviation: 25,011.9
• 95% confidence interval for mean
difference is (22,702.3, 36,417.1).
For the differences of Throughput metric:
• Difference Mean: 168,639,315.1
• Difference Standard Deviation:
140,193,508.1
• 95% confidence interval for mean
difference of is (130,202,929.1,
207,075,701.1).
The 95% confidence interval for mean difference
of both metrics does not include zero. Based on this
analysis, IIS has significantly higher performance
Figure 4: Throughput for Apache and IIS experiments.
Apache Server - Overall WebBench Throughput (Bytes/Second)
0,000
50000000,000
100000000,000
150000000,000
200000000,000
250000000,000
300000000,000
350000000,000
400000000,000
450000000,000
500000000,000
1T
St
at
i
c
1
1
TSt
a
tic2
1T
St
at
i
c
3
1
T
D
yn
ami
c
1
1TDyna
m
ic
2
1
T
Dy
n
ami
c
3
2
TSt
a
ti
c
1
2TSt
a
tic2
2
TSt
a
ti
c
3
2TDy
n
ami
c
1
2
TDyna
mi
c
2
2TDy
n
ami
c
3
4
TSt
a
ti
c
1
4T
St
at
i
c2
4
TSt
a
ti
c
3
4TDynamic
1
4
T
D
yn
ami
c
2
4TDynamic
3
8
TSt
a
tic1
8
TSt
a
ti
c
2
8
TSt
a
tic3
8
TDyna
m
ic1
8TDy
n
ami
c
2
8
TDyna
mi
c3
16T
S
tatic
1
1
6TSta
ti
c2
16TStatic3
16T
D
ynam
i
c
1
1
6
TDyna
m
i
c
2
16T
D
ynam
i
c
3
32TStat
i
c1
3
2
T
Sta
ti
c2
3
2TSta
ti
c3
32T
Dy
n
a
m
i
c
1
32TDynamic2
3
2T
Dy
n
a
m
i
c
3
Mix Name
Throughput (Bytes / Second)
Internet Information Server - Overall WebBench Throughput (Bytes/Second)
0,000
100000000,000
200000000,000
300000000,000
400000000,000
500000000,000
600000000,000
700000000,000
800000000,000
900000000,000
1T
St
at
i
c
1
1
TSt
a
tic2
1T
St
at
i
c
3
1
T
D
yn
ami
c
1
1TDyna
m
ic
2
1
T
Dy
n
ami
c
3
2
TSt
a
ti
c
1
2TSt
a
tic2
2
TSt
a
ti
c
3
2TDy
n
ami
c
1
2
TDyna
mi
c
2
2TDy
n
ami
c
3
4
TSt
a
ti
c
1
4T
St
at
i
c2
4
TSt
a
ti
c
3
4TDynamic
1
4
T
D
yn
ami
c
2
4TDynamic
3
8
TSt
a
tic1
8
TSt
a
ti
c
2
8
TSt
a
tic3
8
TDyna
m
ic1
8TDy
n
ami
c
2
8
TDyna
mi
c3
16T
S
tatic
1
1
6TSta
ti
c2
16TStatic3
16T
D
ynam
i
c
1
1
6
TDyna
m
i
c
2
16T
D
ynam
i
c
3
32TStat
i
c1
3
2
T
Sta
ti
c2
3
2TSta
ti
c3
32T
Dy
n
a
m
i
c
1
32TDynamic2
3
2T
Dy
n
a
m
i
c
3
Mix Name
Throughput (Bytes / Second)
PERFORMANCE ANALYSIS OF WEB SERVERS: Apache and Microsoft IIS
297

metrics than Apache Server.
The result of this analysis was expected, given
inspection of the experimental results. Reviewing
the results of individual runs, one can see that the IIS
has higher values of the measured metrics than the
Apache. But it is interesting to see that the
difference of performance between the two servers
start to diverge as the number of clients is increasing
(right side of Figures 3 and 4). For less than four
clients, both servers have similar performance.
4 CONCLUSION
To manage the relatively short time allocated for the
project, the experiment was conducted in two
phases. In the first phase, all four factors were used,
each on two levels. The objective was to determine
the effects of each factor and thus identify dominant
factors. In the second phase, the experiment was
performed using the dominant factors having critical
effect on the performance of the system under test.
The second phase experiment used an increased
number of levels on a reduced number of factors.
It was clear that Internet Information Server has a
better performance than Apache Server on dynamic
content. One possible explanation is that dynamic
content requires more interactions with the operating
system and evidently IIS is much better integrated
with Windows 2003 Server than an external product
such as Apache.
Although the results demonstrate that IIS is better
than Apache Server (at least running in a Windows
environment) under the heavier workload used in
this comparison, the results for a smaller number of
clients (1 to 3) illustrate better Apache performance.
Thus, for a web site that has a lower level of traffic,
the Apache Server seems to be a good alternative.
Also, looking at graphics showing the throughput
and requests per second, and comparing their
respective variances, it is easy to notice that the IIS
is more consistent than Apache. So IIS seem to be
better suited for systems requiring determinism and
predictability. As potential extensions of this study
one could consider similar experiments with
Linux/UNIX platforms rather than Windows to
show the comparison from a different perspective.
The Webbench used in the study supports only CGI.
The study extension may also include use of ASP,
Servlets, and PHP as the possible dynamic loads.
REFERENCES
Almeida J.M., Almeida V., and Yates D.J., Measuring the
Behavior of a World-wide Web Server, Proceedings of
the Seventh Conference on High Performance
Networking, pp. 57-72, White Plains, NY, 1997
Banga G. and Druschel P.. Measuring the Capacity of a
Web Server under Realistic Loads. World Wide Web
Journal (Special Issue on World Wide Web
Characterization and Performance Evaluation), 1999.
(http://citeseer.ist.psu.edu/banga99measuring.html)
Barford P.R., Modeling, Measurement And Performance
Of World Wide Web Transactions, PhD Thesis. 2001
Hu Y., Nanda A., and Yang Q. Measurement, Analysis
and Performance Improvement of the ApacheWeb
Server. A preliminary work has been presented at the
18th IEEE International Performance, Computing, and
Communications Conference (IPCCC’99) February
10-12, 1999 Phoenix/Scottsdale, Arizona
Lilja D.J. Measuring Computer Performance, A
Practitioner’s Guide. Cambridge University Press,
2000
Mosberger D. and Jin T., httperf - A Tool for Measuring
Web Server Performance, HP - Internet Systems and
Applications Laboratory. March, 1998
Nahum E., Barzilai T., and Kandlur D.. Performance
Issues in WWW Servers. IBM T.J. Watson Research
Center, 1999 (http://citeseer.ist.psu.edu/565918.html)
Prefect F., Doan L., Gold S., Wicki T., and Wilcke W.,
Performance Limiting Factors in Http (Web) Server
Operations. Proceedings of the COMPCON Spring’96.
SPECweb99 Benchmark – White Paper. SPEC Standard
Performance Evaluation Corporation, July, 2000
(http://www.spec.org/web99)
Titchkosky L., Arlitt M. and Williamson C.. Performance
Benchmarking of Dynamic Web Technologies.
Proceedings of the 11TH IEEE/ACM International
Symposium on Modeling, Analysis and Simulation of
Computer Telecommunications Systems
(MASCOTS’03)
WEBIST 2005 - WEB INTERFACES AND APPLICATIONS
298
