
Statistical Analysis of the Human EEG during RF
Exposure from Mobile Phones: An Alternative Method
to Analysis of the EEG in Frequency Bands
Howard D’Costa
1, 2
, Irena Cosic
1, 2
1
School of Electrical & Computer Engineering, RMIT University, Melbourne, Australia
2
Australian Centre for Radiofrequency Bioeffects Research
Abstract. This paper aims to describe a novel statistical approach to analysing
the effects of radiofrequency (RF) exposures from mobile phones on the human
EEG. In addition, the paper describes two limitations that may be encountered
when using statistical methods to analyse the EEG in its frequency bands. The
proposed method of analysis which is based on measures of central tendency
introduces an approach whereby the recorded body of EEG data collected
during trials can be effectively interpreted for spectral analysis at a higher
resolution across the EEG spectrum. It is believed that the proposed statistical
approach may be also useful in other studies investigating the effects of
alternate forms of involuntary stimulus on the human EEG, such as electrical
stimulus, light, and sound.
1 Introduction
It is as yet undetermined whether mobile phone exposures can cause adverse health
implications or changes in human brain function. In an attempt to address these
concerns, researchers have utilised electroencephalographic (EEG) recordings to
determine whether radiofrequency (RF) emissions from mobile phones influence
human brain wave activity. A common approach to statistical analysis in these
investigations, is to analyse the EEG in its generally classified frequency bands,
namely delta (1-4 Hz), theta (4-8 Hz), alpha (8-13 Hz), and beta (13-32 Hz)
[1][2][3][4]. Nevertheless, amongst these studies there can be found slight variations
in the EEG spectral ranges analysed. In a study by Hietanen et al.[5] EEG recordings
were obtained from 19 participants during exposure in separate tests to five active
mobile phones operating at either 900 MHz or 1800 MHz. The phones were
positioned 1 cm from the left side of the head and generated a peak output power
ranging from 1 - 2 W. With the exception of the delta region from one of the test
phones statistical comparisons drawn between control and exposure trials indicated no
significant changes in the EEG frequency bands 1.5 – 3.5 Hz (delta), 3.5 – 7.5 Hz
(theta), 7.5 – 12.5 Hz (alpha), and 12.5 – 25 Hz (beta). In another investigation by
Reiser et al. [6] 36 subjects were exposed to a mobile phone’s RF emissions for a
duration of 15 minutes. The mobile phone had a carrier frequency of 902.4 MHz,
which was modulated at 217 Hz. The phone was programmed to transmit at 8 W, and
D’Costa H. and Cosic I. (2005).
Statistical Analysis of the Human EEG during RF Exposure from Mobile Phones: An Alternative Method to Analysis of the EEG in Frequency Bands.
In Proceedings of the 1st International Workshop on Biosignal Processing and Classification, pages 167-174
DOI: 10.5220/0001197301670174
Copyright
c
SciTePress

was placed at a distance of 40 cm from the rear of the head during the experiment.
Results of the study indicated power increases in the EEG frequency bands of 9.75 Hz
– 12.5 Hz (alpha 2), 12.75 – 18.5 Hz (beta 1) and 18.75 – 35 Hz (beta 2). The
increases occurred approximately 15 minutes after exposure ceased.
Although investigations in this area of study have until now concentrated on analysis
of the EEG in its spectral bands, there is however significant limitations to this
approach that should be considered. With respect to the utilisation of the EEG as
basis to detect an external stimulus, these limitations primarily arise from the
moderate spectral resolution analysis imposed by relatively wide ranges of the EEG
frequency bands. As opposed to analysis of the EEG in spectral bands, alternate use
of non-linear statistical methods have been produced by others in related
electromagnetic field effect studies [6][7].
From an adapted analysis of our previous work (D’Costa et al. [8]), this paper aims to
present a novel statistical approach to analysing the human EEG where all frequencies
within the EEG spectrum can be analysed. In addition, the paper aims to describe and
outline the limitations associated with statistical analysis of the EEG in its spectral
bands.
2 Limitations of Analysis of the EEG in Frequency Bands
There are two evident limitations associated with statistically analysing the EEG in its
frequency bands for the purpose of determining whether an external stimulus such as
mobile phones affect human brain waves. These limitations may be described as
follows:
1. Important data is potentially lost due to averaging in frequency bands when
drawing comparisons between control and exposure EEG data sets. For example, the
alpha EEG band spans over five distinct frequencies from 8 -13 Hz. In order to
prepare this band for hypothesis testing the total EEG power across each of the five
frequencies must be averaged to one value for both the exposure and control test
recordings. For this reason it is arguable that an effect due exposure can occur in any
one of the five frequencies though may be lost through averaging. The probability for
this loss occurring is even more so for the beta band (>13 Hz) where up to 20 or more
frequencies may be averaged.
2. Identification of potential changes in frequency ranges spanning across the EEG
band divisions are not observable which may mask potential effects. For example if
an alteration in the EEG due to an applied exposure existed over a range spanning
from 5 – 9 Hz the effect may become impossible to observe as theta (4 – 8 Hz) and
alpha (8 - 13 Hz) must be independently analysed.
An example of results for an analysis conducted in frequency bands is shown below
in Table 1 (adopted from D’Costa et al. [8]). In this study ten participnats were
exposed to a mobile phone operating at 900 MHz at nominal full-power (2 W peak
output). The EEG was recorded from the frontal, central, and occipital regions of the
head in a series of five control and five exposure tests. A paired t-test analysis was
conducted to draw statistical comparisons between the averaged control and exposure
168

test recordings. The t-test results are indicated below for the four EEG frequency
bands of interest analysed.
Table 1. Shows an example of results adopted from D’Costa et al.[8] for an analysis conducted
in the EEG frequency bands delta (1-4 Hz), theta (4-8 Hz), alpha (8-13 Hz), and beta (13-32
Hz). Statistical levels were considered significant at p-values < 0.05 (shown in italic)
It can be observed in table 1 above that the t-tests results indicated statistically
significant differences in the alpha and beta bands (p-values < 0.05). However, in
contrast and based on the limitations described above, it may also be shown that it is
not possible to determine whether the mobile phone exposure produced a potential
influence across or at particular frequency rhythms within the four EEG bands.
3 Proposed Analysis of the EEG
By employing existing statistical methods, this section describes a novel approach
where all frequencies in the EEG spectrum are considered to investigate the effects of
mobile phone RF exposures on human brain wave activity. The method of analysis is
described in the following 3 stages given the basic case that four control EEG
recordings are to be compared to four exposure EEG recordings acquired from a
sample size of 10 participants (EEG spectral range is 1-32 Hz):
Step 1. From each of the four control and four exposure recordings 4 × 32 EEG
power values (×10) are generated. For each participant, the median EEG power value
of the four control recordings in each EEG frequency (from 1 -32 Hz) minus the
corresponding median in the four exposure recordings is calculated. The resultant
number of positive values or decreases in each EEG frequency is then identified over
the entire sample. Table 2 below demonstrates a mock example of an output table
generated for this step at the arbitrary rhythm of 7 Hz. In a similar manner, the
number of negative values or increases may be alternatively chosen.
Full-power mode trial
Delt
a
T
het
a
Al
p
ha Bet
a
Recording
Site
95% CI
(µV)
p-value 95% CI
(µV)
p-value 95% CI
(µV)
p-value 95% CI
(µV)
p-value
Frontal
-2.3, 7.0 0.281 -1.3, 3.8 0.289 -0.5, 1.8 0.264 -0.6, 1.1 0.519
Central
-1.0, 9.0 0.106 -1.9, 7.0 0.232 0.1, 3.7 0.038 0.03, 1.9 0.045
Occipital
-0.4, 11.3 0.065 -1.3, 8.8 0.13 -0.1, 5.3 0.06 0.01, 3.0 0.049
169
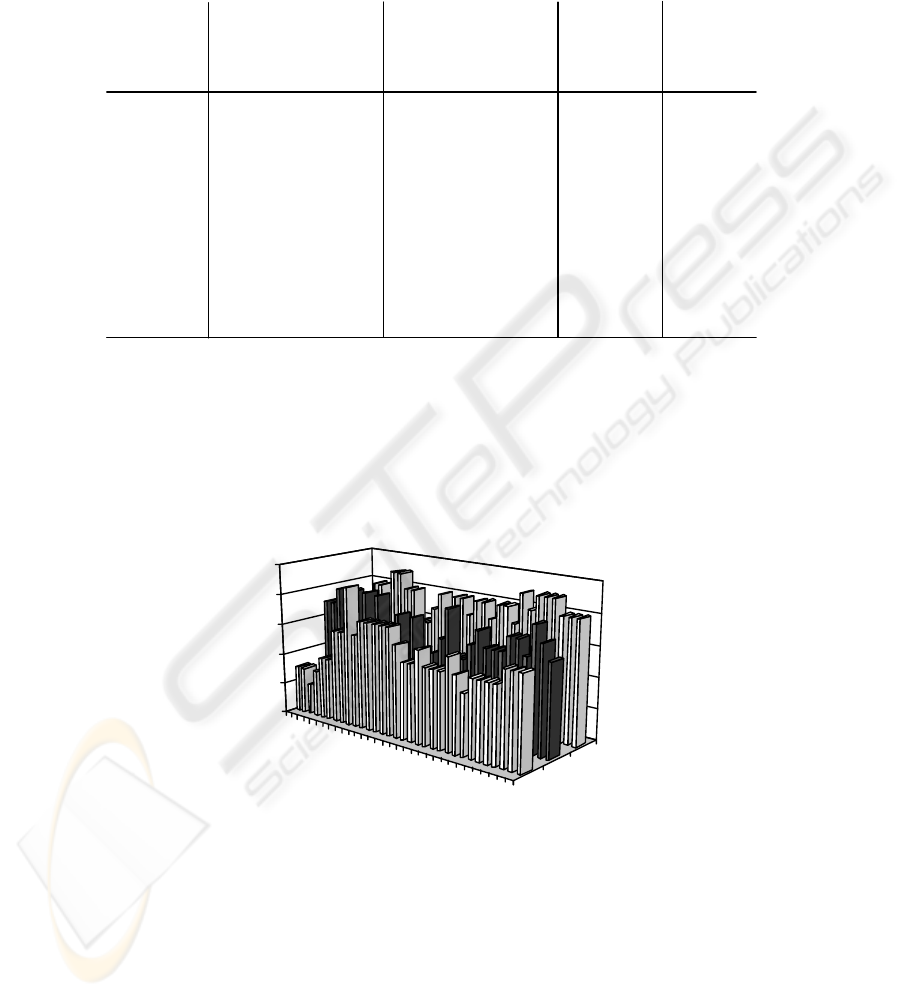
Table 2. Shown is an example of the paired sample of median values of the control and
stimulus EEG recordings at 7 Hz. The median differences in EEG power and respective
identified decreases in EEG can be observed. In this example 8 out of the 10 participants
indicated a decrease in the median EEG power at 7 Hz
By observation of Table 2, it can be seen that up to 80% of the participants for
example indicated a decrease in EEG power at 7 Hz. By repeating this process for all
32 frequencies a distribution of the percentage of subjects indicating a decrease in
EEG power versus frequency may be generated. If EEG recordings were to be
simultaneously acquired from multiple recording site locations on the head a 3D
illustration of these distributions may be shown as given for example in Figure 1(a).
1
2
3
4
5
6
7
8
9
1
0
Participant
Median value of
control recordings
at 7 Hz (µV)
Median value of
stimulus recordings
at 7 Hz (µV)
18
15
25
14
16
26
18
15
16
19
11
16
20
16
10
23
11
12
12
15
Median
difference
at 7 Hz (µV)
7
-1
5
-2
6
3
7
3
4
4
Noted
decrease
in EEG
x
x
x
x
x
x
x
x
Fig. 1.(a) Shows an example of distributions of the percentage of subjects indicating a decrease
in EEG power versus frequency as generated in step 1. As shown, distributions produced for
simultaneous EEG recordings acquired over multiple recording site locations may be indicated.
In this example three recording sites are considered over the frontal, central, and occipital
regions of the head (example adopted from D’Costa et al.[8])
Recording
Site
EEG Rhythm
(Hz)
% of Subjects
Indicating
Decrease in
EEG Power
1
6
11
16
21
26
31
Frontal
Central
Occipital
0
20
40
60
80
100
(a)
170
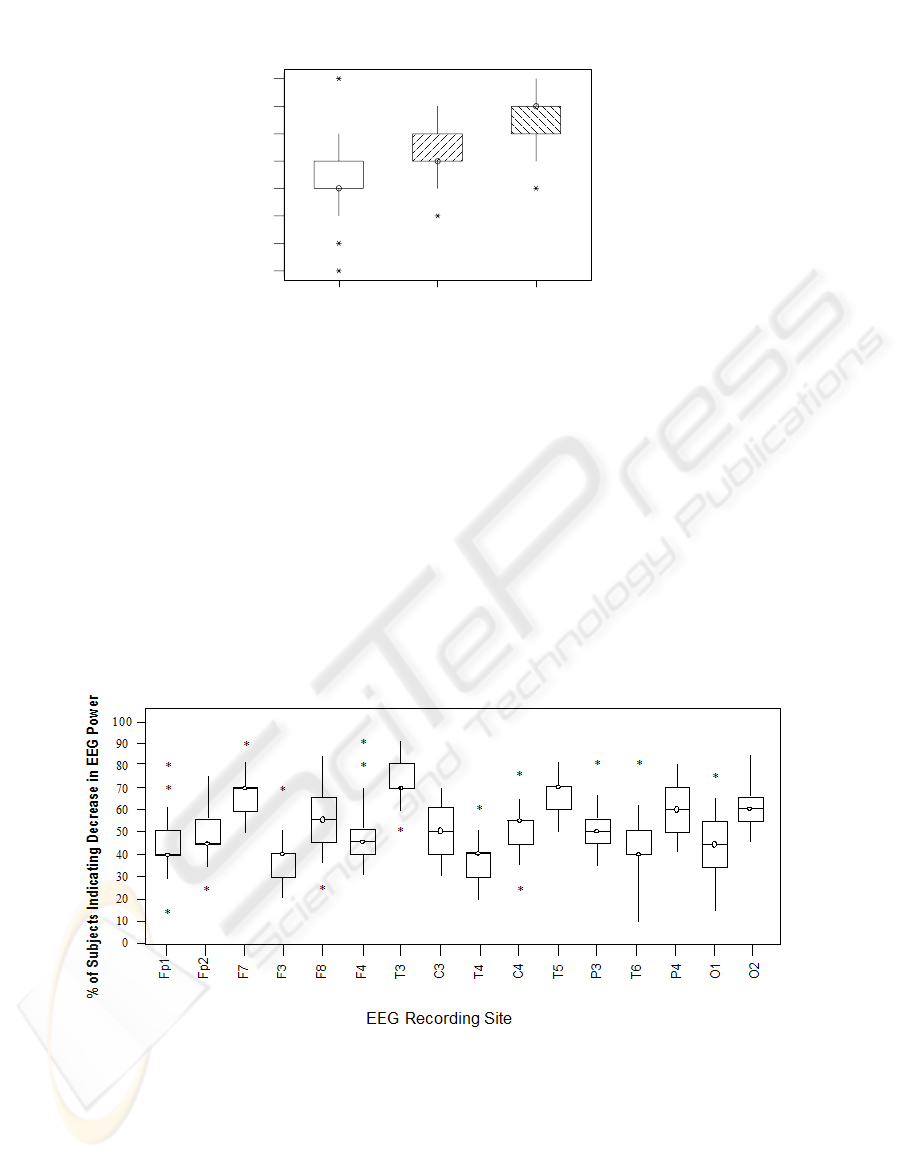
Fig 1(b) The corresponding distribution plots of figure 1(a) as generated for step 2. The
‘boxes’ indicate where at least 50% of the distribution lies. The ‘box-whiskers’ and asterisks
(data outliers) together indicate where at least 25% of the distribution lie
Step 2. For further interpretation, the distributions generated in step 1 (Fig. 1(a)) are
interpreted to standard Box Diagram plots as indicated in Figure 1(b). As per
standard [10] the ‘boxes’ indicate where at least 50% of the distribution lies. The
‘box-whiskers’ and asterisks (data outliers) together indicate where at least 25% of
the distribution lie.
Distribution plots for a larger number of recording regions may also be effectively
shown as Figure 2 below indicates for a standard 16 -point EEG recorded array (10-
20 International standard [11]).
OccipitalCentralFrontal
90
80
70
60
50
40
30
20
% of Subjects
Indicating
Decrease in
EEG Power
Recording Site
(b)
171

Step 3. Lastly, with reference to step 1, a paired t-test analysis is conducted on the
median paired data sets in each frequency where 75-100% of subjects indicate an
increase or decrease in EEG power. Table 3 below demonstrates an example of an
output table of results that may be generated for this step. The table can be observed
to indicate 95% confidence intervals and corresponding p-values produced by the
paired t-test analysis for each of the identified frequency rhythms. The p-values in
this example are considered to be statistically significant for values less than 0.05 as
indicated in italic (example adopted from D’Costa et al.[8]).
Larger data sets, such as in the case for a 16-point EEG analysis, may also be
represented in this manner, or simplified to indicate the significant statistical values.
Table 3. Shows an example of a resultant output table generated in step 3 above
1. Significant p-values
indicated at 9 Hz from
all 3 recording sites
2. Significant p-values
indicated at 7 & 9 Hz
from both the central
and occipital regions
4. Significant p-values
indicated at consecutive
frequencies at 17 & 19
Hz from the occipital
region
3. Significant p-values
indicated at consecutive
frequencies at 7, 8, & 9
Hz from the occipital
region
y
EEG
Rhythm
(Hz)
Rec.
Site
% of
Subjects
Indicating
Decrease
95% CI
(µV)
p-value
3 F 20 -3.1, 4.6 0.673
9 F 90 0.1, 0.6 0.009
3 C 80 -1.9,10.2 0.155
5 C 80 -1.3, 7.5 0.141
7 C 80 0.6, 5.0 0.020
9 C 80 0.5, 4.9 0.022
19 C 80 -0.1, 1.7 0.076
30 C 80 -0.1, 1.7 0.070
4 O 80 -0.9,10.3 0.089
5 O 80 -0.8, 9.7 0.087
7 O 90 0.5, 9.0 0.032
8 O 90 0.7, 8.7 0.026
9 O 80 0.9, 6.9 0.017
10 O 80 -0.4, 7.5 0.073
14 O 80 -0.3, 5.2 0.071
16 O 80 -0.2, 5.7 0.065
17 O 80 0.0, 5.3 0.050
19 O 80 0.0, 4.9 0.050
20 O 80 -0.4, 5.4 0.086
22 O 80 -0.1, 4.3 0.063
23 O 80 -0.1, 3.6 0.056
25 O 90 -0.1, 3.5 0.061
26 O 80 -0.2, 3.0 0.082
27 O 90 0.1, 2.6 0.034
28 O 90 -0.0, 2.4 0.055
29 O 90 -0.2, 2.4 0.078
30 O 80 -0.5, 2.7 0.151
31 O 80 -0.7, 2.4 0.248
32 O 80 -0.5, 1.8 0.231
Mobile phone trial
172

4 Discussion
The proposed method of analysis can be useful in determining whether there is an
effect in the EEG due to mobile phone exposures for several reasons. In general, the
analysis uses an approach by which the raw EEG data is used to identify where
probable effects may occur. To do this, firstly the percentage of subjects indicating a
decrease or increase in each EEG frequency is identified as described in step 1. It
follows in this step that a resultant distribution plot is generated as a function of
percentage of subjects indicating a decrease in EEG power versus frequency (Fig.
1(a)). To interpret this figure clearly it is hypothesised that if there is no change in the
EEG due to the mobile phone exposure over a given sample size, the distribution at
each recording site should tend towards being a uniform 50% over the EEG spectrum.
It thus follows the more the percentage of subjects indicating a change in EEG power
tends away from 50% the more probable it is that a significant difference occurs in
those EEG frequencies demonstrating higher and lower tendencies. Consequently, it
is of interest in step 3 to test the statistical significance of difference in these rhythms.
In addition to the generated distributions in step 1, step 2 introduces the use of box
diagram plots (Fig. 1(b), Fig. 2). As may be observed, the diagrams represent where
the corresponding distributions produced in step 1 lie with respect to each other and
their respective recording sites. In particular, this characteristic is very useful in
demonstrating how the frequency distributions of recording sites near to the position
of a mobile phone RF source may vary with distance.
In the final third step, it is described that a paired t-test analysis is conducted on the
median paired data sets in each frequency (Table 2) where 75-100% of subjects
indicate an increase or decrease in EEG power. By examining this upper high
tendency range (away from 50%) this important stage of analysis significantly
reduces analysing large proportions of probable redundant data and concentrates on
interpreting more likely affected regions. Statistically significant results determined
in this step would therefore be more difficult to disregard as occurring due to
statistical chance. Demonstrated in Table 3 is an example of a resultant output table
generated from step 3. The table shows four prominent trends which occurred
amongst frequencies indicating statistically significant differences in the median
control and exposure EEG recorded sets. Results of prominent interest indicated in
this example from our previous work [8] were EEG frequencies showing statistically
significant changes in EEG power from the occipital region at 7 Hz, 8 Hz, and 9 Hz.
It is of particular interest to note for the purpose of this work that this potentially
important result indicating significant change in consecutive rhythms extending from
within the theta to the alpha EEG range may have otherwise been masked by an
analysis in frequency bands due to the two limitations earlier discussed.
5 Conclusion
This paper proposes an alternative method to analysing the effects of mobile phone
exposures on the EEG in its distinct frequency bands. The main advantage of the
proposed analysis is that all frequencies within the EEG spectrum are considered
173

resulting in a higher resolution analysis to detect potential stimuli from exposure. It is
important to point out in such a case where the effects of an external stimulus is of
interest that it is not important to conduct analysis of the human EEG in its frequency
bands. This is due to the fact that the power in the EEG frequency bands is a
physiologically and mentally dependent parameter that presumably does not differ
during control and exposure conditions. Thus for linear analysis the EEG may be
statistically handled in a manner whereby it is fixed.
Overall, it is thought that the proposed spectral analysis of the EEG is a robust and
sensitive method for which to investigate the effects of radiofrequency exposures
from mobile phones on the human EEG. We look forward to incorporating and
further adapting this method into our current study that is underway to examine the
effects of GSM mobile phone exposures on multiple biosignal responses.
Acknowledgements
We would like to extend our thanks to Dr. Everarda Cunningham for her kind support
in reviewing this work.
References
1. Cook, C.M., Thomas, AW., Keenliside, L., Prato, F.S.: Resting EEG Effects During
Exposure to a Pulsed ELF Magnetic Field. Bioelectromagnetics (2005) 26(5):367-76
2. Eulitz, C., Ullsperger, P., Freude, G., Elbert, T.: Mobile phones modulate response patterns
of human brain wave activity. Neuroreport (1998) 9: 3229-3232
3. Huber, R., Graf, T., Cote, K., Wittmann, L., Gallmann, E., Mather, D., Schuderer, J.,
Kuster, N., Borbely, A., Achermann, P.: Exposure to pulsed high-frequency
electrogmagnetic field during waking affects human sleep EEG. Neuroreport (2000) 11:
1321-1325
4. Röschke, J., Mann, K.: No short-term effects of digital mobile radio telephone on the
awake human electroencephalogram. Bioelectromagnetics (1997) 18: 172-176
5. Hietanen, M., Kovala, T., Hämäläinen, A-M.: Human brain activity during exposure to
radiofrequency fieldsemitted by cellular phones. Scandinavian Journal of Work
Environment & Health (2000) 26: 87-92
6. Bachmann, M., Kalda, J., Lass, J., Tuulik, V., Säkki, M., Hinrikus, H.: Non-linear analysis
of the electroencephalogram for detecting effects of low-level electromagnetic fields.
Medical & Biological Engineering & Computing (2005) 43:142-149
7. Lipping, T., Olejarczyk, E., Parts, M.: Analysis of photo-stimulation and microwave
stimulation effects on EEG signal using Higuchi’s fractal dimension method. Proceedings
of SPIE (2004) 5505: 174-178
8. D’Costa, H., Trueman, G., Tang, L., Abdel-rahman, U., Abdel-rahman, W., Ong, K., Cosic,
I.: Human brain wave activity during exposure to radiofrequency field emissions from
mobile phones. Australasian Physical & Engineering Sciences in Medicine (2003) 26[4]:
162-167
9. Reiser, H.-P., Dimpfel, W. Schober, F.: The influence of electromagnetic fields on human
brain activity. European Journal of Medical Research (1995/96) 1: 27-32
10. Sirkin, R. Mark.: Statistics for the Social Sciences. 2nd Edn. Thousand Oaks, Calif.:Sage
Publications (1999)
11. Aston R, Principles of Biomedical Instrumentation and measurement, Meril (1990)
174
