
Measuring the Emotional and Physiological Effects of
Light and Colour on Space Users
Nadeen Abbas
1
, Dinesh Kumar
1
and Neil Mclachlan
1
School of Electrical and Computer Engineering,
RMIT University,
PO Box 2476V
Melbourne,
Australia - 3001
A
bstract. Colour and light are known to have an impact on our health and well-
being. While large resources are allocated for well designed buildings with the
right choice of colours and lighting conditions, there is little scientific evidence
that supports these choices. The aim of this research was to determine the impact
of different colours and lighting conditions on people, using non-invasive means.
Close correlations between skin conductance (SC), our emotions and health are
well reported in literature and hence these are expected to be good measures of
the environmental conditions on people.
1 Introduction
There are numbers of factors in a constructed environment that influences the psycho-
logical and emotional state of the users in that space. Light intensity and colour are
two important factors with impact on users’ performance in the space. While people
are known to adapt to different environments, the different conditions have an impact
on their productivity and general wellbeing. For effective usage of our buildings, it is
important to have an objective measure of these factors on the health and wellbeing of
human.
The literature on light and colour is extensive, however a uniform set of findings is
lacking for a consistent perspective on the influence of colour and light. There are num-
bers of publications that report the research conducted to determine the effect of various
lighting and colour conditions on peoples’ emotions. Most of these are based on subjec-
tive measures [1], [2], [3], [4]. The subjects complete questionnaires to describe their
feelings after being exposed to different colour and lighting conditions. Research con-
ducted by Karrie on interior design for ambulatory care facilities reports some important
design factors. The research reports that colour and lighting have profound influence on
patients and consumers satisfaction, stress level, health and wellbeing. The paper also
reports that the effects of colour and lighting are inseparable and lighting intensity af-
fects the perception of colour [5].
Abbas N., Kumar D. and Mclachlan N. (2005).
Measuring the Emotional and Physiological Effects of Light and Colour on Space Users.
In Proceedings of the 1st International Workshop on Biosignal Processing and Classification, pages 78-86
DOI: 10.5220/0001194200780086
Copyright
c
SciTePress

The research by Igor Kenz reports subjective tests to study the effects of the rec-
ommended office lighting on mood and cognitive performance. The work demonstrates
that the physical setting of an office and the use of artificial light can have a significant
impact on the mood of the inhabitants [1]. Another research conducted by Warren E.
Hathaway has found that students who study under daylight like light were less absent
and achieved higher scores than those working under yellowish-orange sodium vapour
bulbs [4].
However the outcome of subjective tests is uncertain. It has been reported that sub-
jective tests such as questionnaires are insufficient and may be misleading especially
when conducted at the end of the experiment [6], [7]. Often, participants may mix their
emotions between the start and the end of experiments, and the recollection of a series
of emotions that occurred earlier may lack accuracy.
Peter J. Lang said that emotion manifests itself in three separate aspects of people;
(i) physiological, (ii) psychological (i.e. subjective experience) and (iii) behavioural.
The physiological is the change in the physical properties of the person, psycholog-
ical being the subjective experience while the behavioural is manifest by the physical
actions such as approach and avoidance, and each of these associated with specific mea-
sures [6], [7]. The paper also suggests that it is necessary not to limit the studies to the
assessment of a single response but include sample measures from each of the three
manifestations.
Research was conducted by Binjamin to identify the impact of short film clips (6s)
on people, where some of these clips were coloured and some were black and white.
Skin conductance, heart rate and facial movement were used in the research as physio-
logical measures in addition to subjective tests to study the short term effect of colours
on people. The results indicated that colour has a small effect on the subjective ex-
perience but did not exert a main effect on the skin conductance response. The paper
recommended further studies to explore the impact of colour and light on physiological
measures using stimuli of longer time durations [8].
The authors are unable to find any research that has measured the physiological
changes in people due to light and colour stimuli of long duration. To identify the best
choice of interior conditions for buildings there is a need to determine the physiological
changes in people under these conditions. The reasonably long exposure is to allow the
participants of the study to adapt to the conditions.
1.1 Skin Conductance and Emotions
Skin conductance (SC) is one of the fastest responding non-invasive measures of auto-
nomic nervous system activity. It is a method of capturing the autonomic nerve response
as a parameter of the sweat gland. Physically SC is a change in the electrical properties
of the skin in response to different kinds of stimuli. The response is measured by the
change in voltage from the surface of the skin [9].
The close correlation between SC and emotions is well documented in the literature.
Lane reported that SC shows different values for different emotions when studying the
effects of emotional valence, arousal and attention on neural activation during visual
processing of pictures [10]. Storm also reported that SC fluctuations are a measure of
preoperative stress [11]. Healy used SC as a measure of the emotional stress developed
79

during driving [12]. Heo used SC as a measure of emotional response to web advertising
[13].
The aim of this research was to provide a definitive answer for the choice of light
and colour conditions in a constructed environment for the betterment of health and well
being of the occupants. This paper reports experimental research conducted to identify
the physiological changes when exposed to different light and colour conditions. For
this aim, the paper reports changes in the SC of people when exposed to different colour
and intensity lights for periods of time that allowed the participants to adapt to the
conditions.
The research has been built on the current body of knowledge that physiological
measures are necessary to measure the effects of light intensity and colour on people to
ensure objectivity and reproducibility of the experiments. This would remove the short-
comings of earlier research where questionnaire-based and other subjective experiments
were used for identifying the effect of colour and light conditions. The aim is to help
provide an objective rational for the choice for light intensity and colour by architects
for different buildings.
2 Methodology
To determine the physiological changes due to the exposure of people to different light
and colour conditions, it was important to conduct controlled experiments where all
other conditions were kept constant. This was necessary to ensure that the changes
recorded were due to the effect of light and colour conditions only. To measure the
physiological changes, experiments were conducted where measurable changes in SC
were recorded in response to change in colour and intensity of light.
2.1 Subjects
The experiments were conducted on 15 healthy subjects comprising 3 males and 12
females. They were not under any medication that may affect their mental and neural
activities. The participants were recruited with the help of posters and most were uni-
versity students. Their participation was voluntary. Ethics approval for the experiments
was obtained and subjects completed consent forms before the experiment. Subjects
were made aware of the details of the experiments and were also informed that they
could stop the experiment if they chose to.
2.2 Experimental set up
The experiments were conducted in a neutrally coloured and furnished multi-user lab-
oratory approximately 10m x 4m in size. Subjects were seated comfortably facing a
1.5m x 2m white non-reflecting screen approximately 1.5m away from the chair. Envi-
ronmental conditions such as air temperature and humidity, furniture and layout setting
were kept constant. All experiments were conducted in a quiet laboratory early in the
morning to exclude noise disturbance and circadian rhythms as potential confounds.
The order and interval of exposure to lights were kept constant for all subjects. The
80

participants were exposed to the different light and colour conditions by illuminating
the screen with floodlights that had globes of green, red and blue colours. The light
conditions were recorded using LUX and FC light meter. During the experiments, the
participants were exposed to eight different colour and light intensities which are de-
scribed in table 1. The duration of the complete experiment was approximately 110
minutes. In preliminary experiments it was observed that eight minutes were sufficient
to ensure that the participants adapted to the light and colour. Skin conductance was
recorded for two minutes after the eight minutes had elapsed.
Table 1. Intensities of coloured lights used.
Colour of lights Intensity of light/ lux
White 207
Blue low 28
Blue high 48
Green low 90
Green high 169
Red low 92
Red high 157
Natural 20 - 105
At the start of the experiment, the fingers were prepared for recording SC using
wipes. Two electrodes were wrapped around two fingers in the right hand for the dura-
tion of the complete experiment. The subjects’ SC was recorded in the last 2 minutes of
each coloured light. The signals were recorded using Amlab biosignal recording equip-
ment with sampling rate of 200 samples/second. The quality of signals was visually
monitored at the start and during the experiment. The data was saved as text files and
analysed using Matlab. A three minutes break was given to the subjects after each light
condition where they were allowed to relax and move. During the experiment, the par-
ticipants were engaged in continuous and pre-prepared non-controversial discussions on
the history of architecture so as to reduce stress due to boredom. The style of speaking
was maintained constant to avoid the sound and conversation related variations during
the experiments.
3 Results and Discussion
In this section the results of the experimental data have been analysed. Skin conductance
of the human body has continuos variation over time even when there are no external
stimuli. The aim of this research was to identify the changes in SC due to the lighting
and colour conditions. For this aim the values of SC were recorded for 2 minutes under
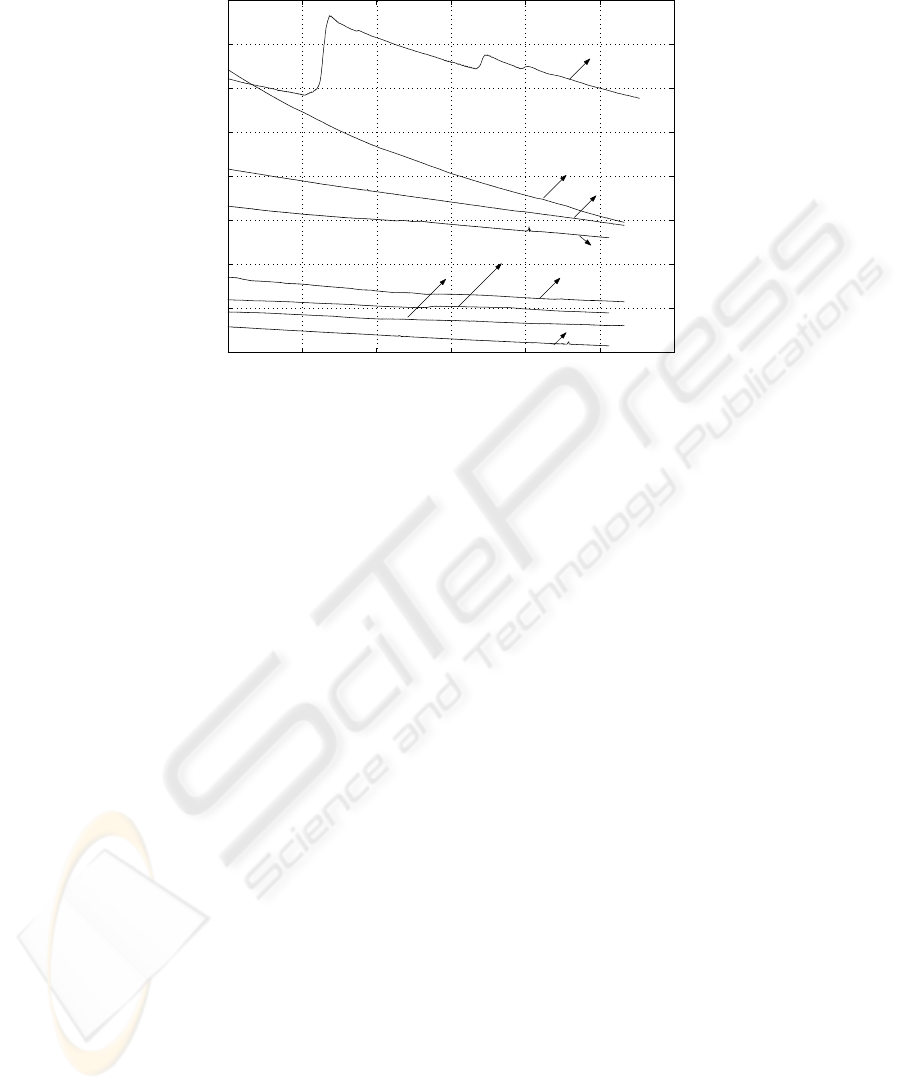
each colour and intensity light for all the subjects. These recordings were graphed for
each subject; the graph for subject 10 is shown as an example in fig 1.
The values of SC were then averaged over the two minutes for each colour and
lighting condition. The mean and the standard deviation of SC values for the two minute
81
0 0.5 1 1.5 2 2.5 3
x 10
4
5
6
7
8
9
10
11
12
13
Samples
Skin conductance, micro siemens
Green low
Red low
Red high
Natural
Blue high
White
Blue low
Green high
Fig.1. Skin conductance for subject 10 under different colour lights
recording were tabulated and are shown in table 2. The SC under white light was then
taken as a base level for each subject and SC readings under all other colour lights were
compared to it. Subtracting the mean SC under white light from each coloured light
provided these figures; the results were tabulated and are shown in table 3. The results
were also normalised for each subject by taking the mean SC under white light as a
reference, the results were tabulated and are shown in table 4.
The difference in mean SC, obtained from table 3, was then put into bar charts for
comparison. An example for subject 10 is shown in fig 2.
As can be seen from table 2, there are changes in SC under different colour and
intensity lights. From tables 3 and 4, it has been observed that 60-73% of the non-white
conditions caused higher skin conductance than white conditions. It is also noted that
some colours caused greater change in SC than other colours. Natural light caused the
largest increase in SC for 20% of the subjects and the largest decrease in SC for 20%
of subjects. Green high light caused the largest increase in SC for 13% of the subjects
and the largest decrease in SC for 13% of the subjects. Red high light caused the largest
increase in SC for 20% of the subjects and blue low light caused the largest decrease in
SC for 20% of the subjects.
It has also been observed that the direction of change in SC (increase or decrease)
is subject dependent, where the same colour and intensity light can cause an increase
in SC for some subjects and a decrease in SC for others. However it is also noted from
the results that the inter subject variation is large. That can be seen clearly from the last
rows in tables 3 and 4 where the variation in SC between different colour and intensity
lights is relatively small compared to the inter subject variation.
T-test was conducted to determine if the change in mean SC due to different colour
and intensity lights is significant. The results are shown in table 5.
82
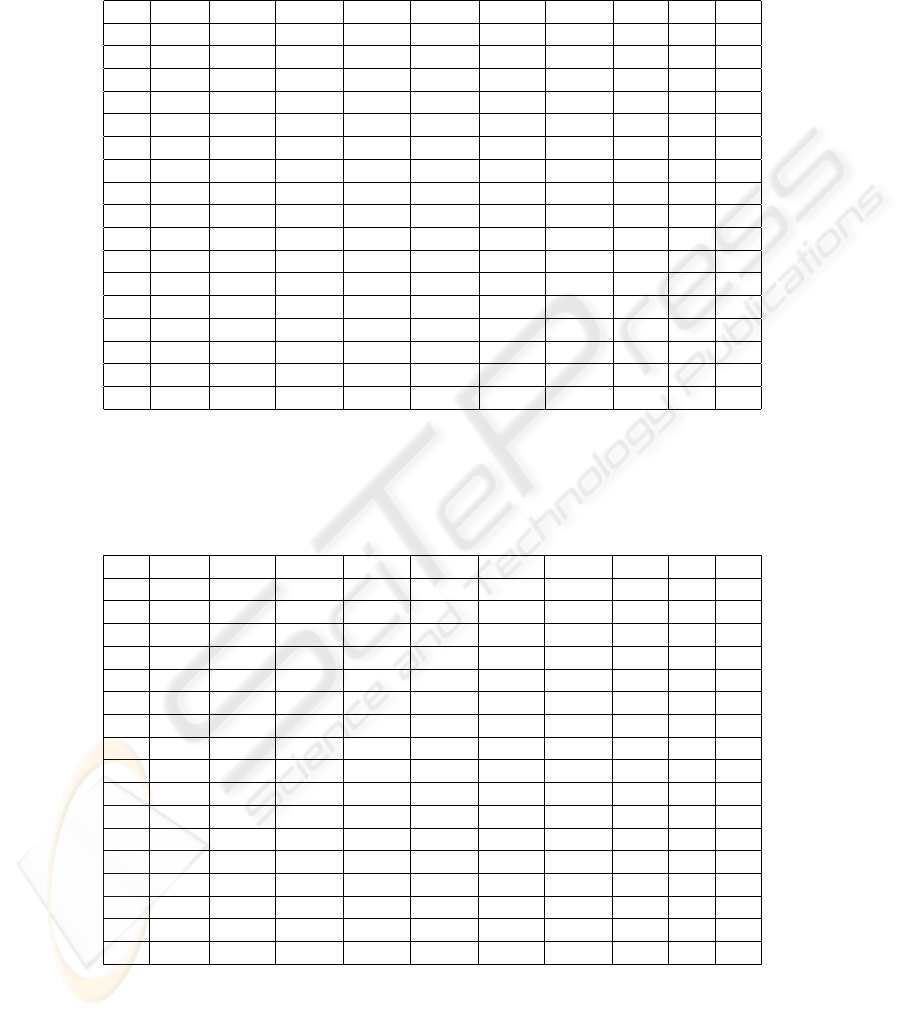
Table 2. Mean Skin Conductance values.
Subj W light BL light BH light GL light GH light RL light RH light N light Mean SD
1 20.38 13.65 16.18 19.95 13.59 19.61 20.38 21.34 18.14 3.17
2 7.9 9.31 7.64 6.8 6.22 6.13 5.22 6.09 6.91 1.30
3 16.5 27.12 26.54 99.91 99.92 64.62 17.36 41.39 49.17 34.90
4 60.7 61.22 59.12 56.72 54.61 53.1 51.89 51.05 56.05 3.99
5 9.14 12.71 11.09 10.49 11.37 8.58 10.07 7.45 10.11 1.68
6 13.99 15.55 23.77 31.24 16.85 18.5 21.81 25.25 20.87 5.77
7 27.13 50.31 49.95 39.22 43.57 55.28 53.89 69.56 48.61 12.48
8 55.74 25.6 65.09 47.32 90.25 99.92 99.92 99.92 72.97 28.63
9 30.44 15.06 13.88 43.02 38.7 33.98 45.66 37.46 32.28 11.97
10 6.05 5.75 6.38 9.41 5.36 8.51 7.96 11.47 7.61 2.12
11 40.04 55.35 50.35 51.93 57.88 59.87 63.02 47.25 53.21 7.42
12 25.04 28.55 30.77 35.59 37.57 35.05 42.08 35.96 33.83 5.42
13 38.2 74.78 64.01 23.62 28.94 29.13 24.36 40.91 40.49 19.05
14 7.46 7.07 6.84 6.63 7.61 7.78 6.72 5.68 6.97 0.67
15 8.1 9.6 9.42 10.07 11.57 11.33 11.14 10.52 10.22 1.17
Mean 24.45 27.44 29.40 32.79 34.93 34.09 32.10 34.09 - -
SD 17.65 22.24 22.23 25.33 30.07 27.41 26.86 26.42 - -
Table 3. Difference in mean skin conductance.
Subj W light BL light BH light GL light GH light RL light RH light N light Mean SD
1 0 -6.73 -4.2 -0.43 -6.78 -0.77 0.01 0.97 - 2.56 3.17
2 0 1.4 -0.26 -1.11 -1.69 -1.77 -2.68 -1.81 - 1.13 1.30
3 0 10.62 10.04 83.42 83.42 48.13 0.86 24.89 37.34 34.90
4 0 0.52 -1.58 -3.98 -6.09 -7.6 -8.81 -9.65 - 5.31 3.99
5 0 3.57 1.95 1.35 2.22 -0.57 0.93 -1.69 1.11 1.68
6 0 1.56 9.78 17.25 2.86 4.51 7.83 11.26 7.86 5.77
7 0 23.18 22.82 12.09 16.44 28.15 26.76 42.43 24.55 12.48
8 0 -30.14 9.36 -8.41 34.51 44.18 44.18 44.18 19.69 28.63
9 0 -15.38 -16.56 12.58 8.25 3.54 15.21 7.02 2.09 11.97
10 0 -0.3 0.32 3.36 -0.7 2.45 1.9 5.42 1.78 2.12
11 0 15.31 10.3 11.89 17.84 19.83 22.97 7.21 15.05 7.42
12 0 3.51 5.73 10.55 12.53 10.01 17.05 10.92 10.04 5.42
13 0 36.58 25.81 -14.58 -9.27 -9.07 -13.84 2.7 2.62 19.06
14 0 -0.39 -0.62 -0.83 0.16 0.32 -0.74 -1.78 - 0.55 0.67
15 0 1.49 1.32 1.97 3.47 3.23 3.04 2.42 2.42 1.17
Mean - 2.99 4.95 8.34 10.48 9.64 7.64 9.63 - -
SD - 15.38 10.50 22.50 23.17 17.64 15.10 15.75 - -
83
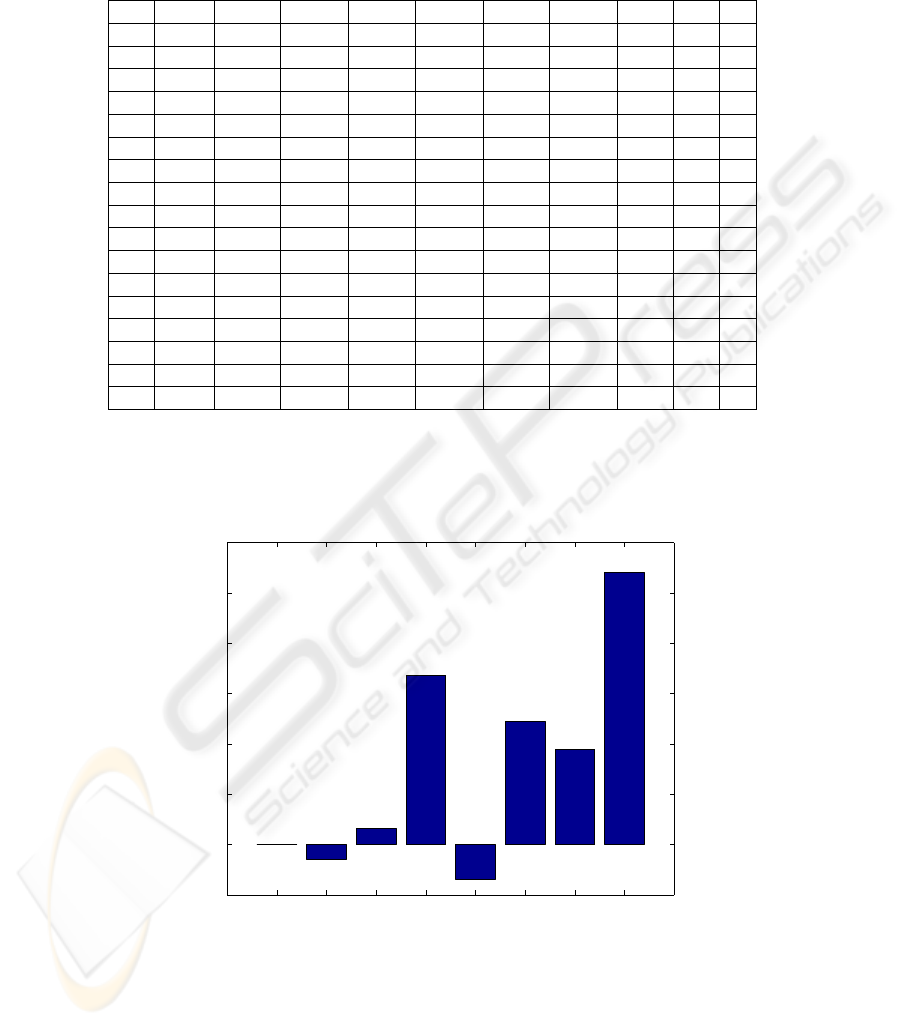
Table 4. Normalised values of mean skin conductance (white light as reference).
Subj W light BL light BH light GL light GH light RL light RH light N light Mean SD
1 1 0.67 0.79 0.98 0.67 0.96 1.00 1.05 0.87 0.16
2 1 1.18 0.97 0.86 0.79 0.78 0.66 0.77 0.86 0.17
3 1 1.64 1.61 6.06 6.06 3.92 1.05 2.51 3.26 2.12
4 1 1.01 0.97 0.93 0.90 0.87 0.85 0.84 0.91 0.06
5 1 1.39 1.21 1.15 1.24 0.94 1.10 0.82 1.12 0.19
6 1 1.11 1.70 2.23 1.20 1.32 1.56 1.80 1.56 0.39
7 1 1.85 1.84 1.45 1.61 2.04 1.99 2.56 1.91 0.36
8 1 0.46 1.17 0.85 1.62 1.79 1.79 1.79 1.35 0.54
9 1 0.49 0.46 1.41 1.27 1.12 1.50 1.23 1.07 0.42
10 1 0.95 1.05 1.56 0.89 1.41 1.32 1.90 1.29 0.36
11 1 1.38 1.26 1.30 1.45 1.50 1.57 1.18 1.38 0.14
12 1 1.14 1.23 1.42 1.50 1.40 1.68 1.44 1.40 0.18
13 1 1.96 1.68 0.62 0.76 0.76 0.64 1.07 1.07 0.54
14 1 0.95 0.92 0.89 1.02 1.04 0.90 0.76 0.93 0.09
15 1 1.19 1.16 1.24 1.43 1.40 1.38 1.30 1.30 0.11
Mean - 1.16 1.20 1.53 1.49 1.42 1.27 1.40 - -
SD - 0.44 0.38 1.31 1.30 0.78 0.42 0.59 - -
1 2 3 4 5 6 7 8
−1
0
1
2
3
4
5
6
Colour of lights
Change in SC, micro siemens
Subject 10
White
Blue low
Blue high
Green low
Green high
Red low
Red high
Natural
Fig.2. Difference in mean skin conductance compared to white light for subject 10
84

Table 5. T-test for change in mean skin conductance.
colour of light t-value p-value
Blue low -0.408 0.6904
Blue high -0.675 0.5107
Green low -1.046 0.3054
Green high -1.164 0.2634
Red low -1.145 0.2626
Red high -0.921 0.368
Natural -1.174 0.2559
The t-test shows a high p-value under all colour lights (p > 0.05) which means that
the variation of SC in response to colour and lighting conditions is not significant.
The results show that there is a change in SC under different colour and intensity
lights. Results also show that some colours and intensities caused greater impact on the
SC of participants than others. Since SC is associated with arousal of the participants,
from the experiments we can see that white light caused the most relaxed state (lowest
SC) in 2/3 of the experiments. However it is also observed that the inter subject varia-
tion in SC is relatively high in the 15 participants. That is also confirmed in the t-test
which shows that the change in SC in response to different colour and intensity lights
is not significant. From the above it is not possible to co-relate the changes in SC to the
specific colour and intensity lighting conditions.
Previous research reported by Binjamin [8] reported that short term colour exposure
(6 seconds) did not exert a main effect on the skin conductance response. This research
demonstrates that there is a change in SC when people are exposed to different colour
and lighting conditions for longer periods of time (10minutes). However the inter sub-
ject variation is very large which makes it hard to co-relate the changes in SC to the
specific colour and lighting conditions.
4 Conclusion
This research investigates the emotional and psychological effects of different colour
and lighting conditions on people. It reports changes in the SC of 15 subjects when ex-
posed to different colour and intensity lights. The research demonstrates that the change
in colour and intensity of light caused a change in SC. It also shows that some colours
have greater impact on SC than others. In most experiments (2/3 of the experiments)
white light caused the lowest SC, which means that it provided the most relaxing con-
dition. However the hypothesis t-test analysis for change in mean SC due to different
colour and intensity lights indicated that the changes in SC are not significant, that is
due to the large inter subject variation. The research has not studied the difference be-
tween the response to different colour and intensity lights based on gender and age [14],
the authors would recommend that further experiments would take that into account.
85

References
1. Kenz, I., Enmarker, I.: Effect of office lighting on mood and cognitive performance and a
gender effect in work-related judgment. Envinronment and behaviour 30 (July 1998) 553–
567
2. Leather, P., Pyrgas, M., Beale, D.: Windows in the workplace: Sunlight, view, and occupa-
tional stress. Environment and Behaviour 30 (1998) 739–762
3. Hupka, R., Zaleski, Z., Otto, J., Reidl, L., Tarabrina, N.: The colors of anger, envy, fear, and
jealousy: A cross-cultural study. Journal of Cross Cultural Psychology 28 (1997) 156–171
4. Hathaway, W.: School performance: A case of daylight robbery. Psychology today 27 (1992)
8
5. Frasca-Bealieu, K.: Interior design for ambulatory care: How to reduce stress and anxiety of
patients and families. Ambulatory care management Gaithersburg 22 (1999) 67–73
6. Lang, P., Greenwald, M., Bradley, M., Hamm, A.: Looking at pictures: affective, facial,
visceral, and behavioural reactions. Psychophysiology 30 (1993) 261–273
7. Bradley, M., Lang, P.: Measuring Emotion: Behavior, feeling and physiology. New York :
Oxford University Press, New York (2000)
8. Detenber, B., Simons, R., Reiss, J.: The emotional significance of color in television presen-
tations. Media Psychology 2 (2000) 331–335
9. Tarvainen, M., Karjalainen, P., Koistinen, A., Valkonen-Korhonen, M.: Principal component
analysis of galvanic skin responses. Chicago 2000 conference (2000)
10. Lane, R., Chua, P., Dolan, R.: Common effects of emotional valence, arousal and attention on
neural activation during visual processing of picture. Neuropsychologia 37 (1999) 989–997
11. Storm, H., Myre, K., Rostrup, M., Stokland, O., Lien, M., Rder, J.: Skin conductance corre-
lates with perioperative stress. Acta Anaesthesiologica Scandinavica 46 (2002) 887–895
12. Healey, J., Seger, J., Picard, R.: Quantifying driver stress: Developing a system for collecting
and processing bio-metric signals in natural situations. Proceedings of the Rocky Mountian
Bio-Engineering Symposium (1999)
13. Heo, N.and Sundar, S.: Emotional responses to web advertising: The effects of animation,
position, and product involvement on physiological arousal. Advertising division at the an-
nual conference of the Association for Education in Journalism and Mass Communication
(AEJMC), Phoenix Arizona (2000)
14. Kenz, I., Kers, C.: Effect of indoor lighting, gender and age on mood and cognitive perfor-
mance. Envinronment and behaviour 32 (2000) 817–831
86
