
Intrinsic Classification of Single Particle Images by
Spectral Clustering
Yutaka Ueno
1
, Masaki Kawata
2
and Shinji Umeyama
1
1
Neuroscience Research Institute,
2
Grid Technology Research Center,
National Institute of Advanced Industrial Science and Technology, 1 Umezono Central-2,
Tsukuba, 305-8568, Japan
Abstract. An application of spectral clustering to single particle analysis of a
biological molecule is described. Using similarity scores for the given data set,
clustering was performed in a factor space made by the eigenvector of the
normalized similarity matrix. Image data was thus classified by means of
information intrinsic to the ensemble of given data. The method was tested on a
simulated transmission electron microscopy image and a real image data set of
70S ribosome. The average images of clusters were obtained by iterative
alignment, which successfully represented characteristic views of the target
molecules. Comparisons with traditional methods and techniques in practical
implementation are discussed.
1 Introduction
With the increasing attention given to single particle analysis for structural analysis of
biological molecules, novel classification algorithms and mathematical studies are in
demand for automated image processing. A currently popular image processing
method first tries to align all images in rotation and translations, then performs
multivariate statistic analysis –– in particular, correspondence analysis –– to classify
images into sub classes [1]. Then, images for a class are searched from the whole set
of images and the members of the class refined. This process is called multi-reference
alignment. While many studies in structural biology have benefited from this method,
very careful assessment of classification results are required [2].
Unfortunately, the obtained class average images are often not sufficient for
subsequent structural analysis of the molecule. Under the minimum dose condition in
transmission electron microscopy, the obtained images are immersed in substantial
background noise, and image alignment is a critical step [1]. Although a reference
free alignment [3] was proposed to align images without prior knowledge of the
particle structure, the classification task is hardly trivial. Invariant classification [4]
also addresses this problem of unsupervised clustering; however, its performance is
insufficient for wider application in this field [5].
In contrast, data mining studies –– for example, information discovery in large text
database and trade information database systems –– have researched various
Ueno Y., Kawata M. and Umeyama S. (2005).
Intrinsic Classification of Single Particle Images by Spectral Clustering.
In Proceedings of the 1st International Workshop on Biosignal Processing and Classification, pages 60-67
DOI: 10.5220/0001193800600067
Copyright
c
SciTePress
algorithms to meet the emerging demand. Spectral clustering [6], which groups data
by an eigenvalue method, has demonstrated advanced performance in text data
clustering [7] and image segmentation problems [8]. The kernel principal component
analysis [9] which has been developed differently, shares the same concept of
eigenvalue solutions, emphasizing the efficiency of the nonlinear kernel function
introduced to the distance measure for the observed data set.
In this paper, we consider the unsupervised clustering
1
of molecular images for
alignment within a consistent set group. Instead of a reference-based method, which
involves potential bias to preferences, we have applied spectral clustering, and
evaluated its performance with simulated transmission electron microscope images
and a data set from a real observation. Our results illustrate that appropriate groups
are resolved through intrinsic classification of images with a common motif. We also
discuss a mechanism for clustering images and indispensable techniques in practical
implementations for single particle analysis.
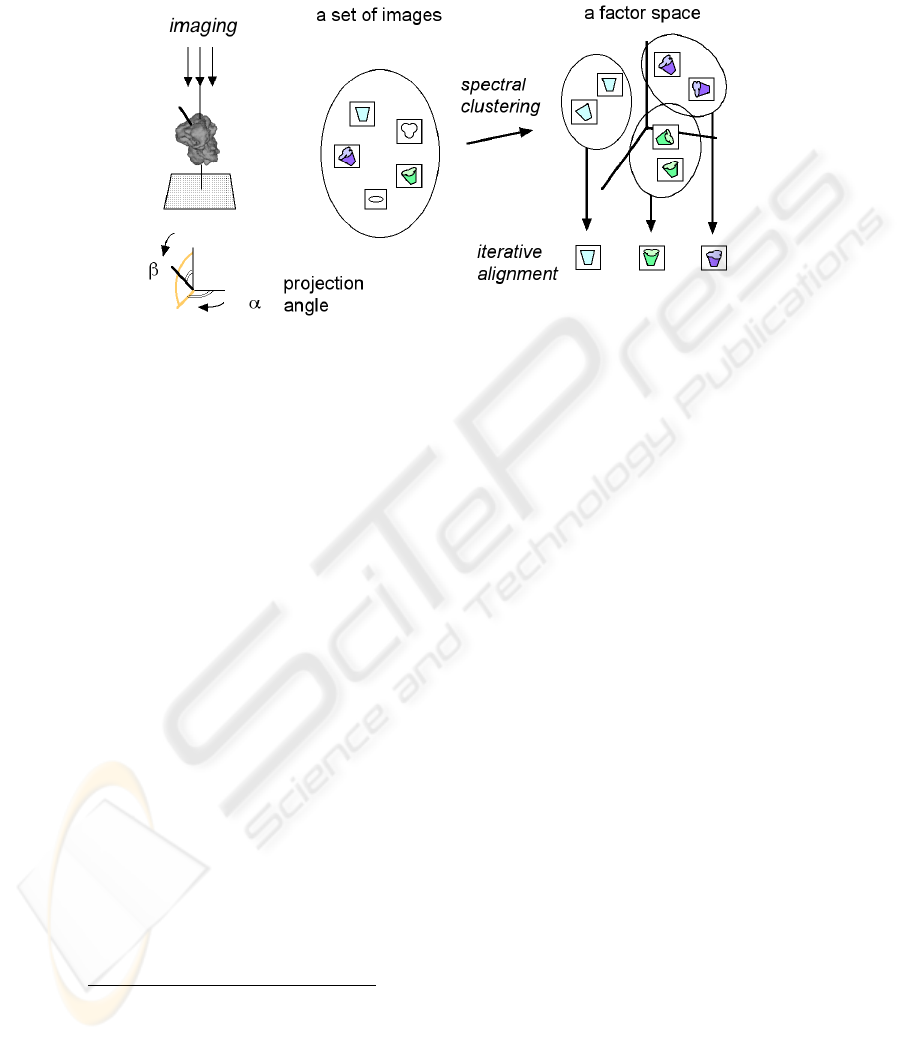
Fig. 1 illustrates an overview of single particle analysis with spectral clustering.
Digitized micrographs are windowed into individual particle images. Noise must then
be reduced by averaging images, grouping and alignment of images. Spectral
clustering involves mapping images onto a factor space, which is different from one
used in correspondence analysis [10], then the images are grouped by means of their
coordinates. The obtained images in a group are aligned and averaged by the iterative
alignment method [3].
1
The word "clustering" is used for unsupervised grouping, while "classification" implies
supervised grouping of a data set.
Fig. 1. Overview of single particle analysis with spectral clustering. Similar pairs of images are
mapped in near locations on a factor space
61

2 Method
2.1 Spectral Clustering
Below are the steps for the Ng-Jordan-Weiss algorithm [6] for spectral clustering of k
subsets for a given set of points S={s
1
,s
2
,...,s
n
} in R
n
:
1. From the similarity matrix
2
A in R
n
x
n
defined by A
ij
= exp(-||s
i
-s
j
||
2
/σ
2
) for i≠j and
A
ii
=0.
2. Define D to be the diagonal matrix with D
ii
= Σ
j=1,n
A
ij
3. Normalize N = D
-1/2
AD
-1/2
4. Find x
1
,x
2
,...,x
k
the k largest eigenvectors of N and form the matrix X=[x
1
,x
2,
,...,x
k
]
5. Normalize the rows of X to be of unit length
6. Treating each row of X as a point in R
k
, cluster into k clusters using k-means or
any other sensible clustering algorithm.
7. Assign the original point s
i
to cluster j if and only if row i of X was assigned to
cluster j.
The scaling parameter σcontrols how rapidly the similarity values fall off. There
are other studies for normalization step 3, which can adapt to individual problems [7].
2.2 A Fast Calculation of Similarity Between Images
The cross correlation of images is used for the similarity measure between images.
The similarity of two images, x and y, is evaluated by maximizing the cross
correlation in rotation R and translation t of image y.
Crr(x, y) = (x
i
− x )(y
i
− y )
i
pixels
∑
σ
x
σ
y
(1)
c
xy
= max
R,t
Crr(x,T(y;R,t)) (2)
_
x
i
is the i-th pixel of image x; x and σ
x
is the mean and the standard deviation of
image x; T(y;R,t) designates the transformed image. Then, the similarity matrix is
defined as follows.
Α
xy
= exp((1- c
xy
)/σ
2
) (3)
Spectral clustering requires these distance values between all pairs of images with
the best matching rotation and translations, that distinguish our method from the
traditional method. Since it requires extensive computation, we devised a fast
calculation method. Both rotation and translation searches are performed in two steps,
coarse and fine. In addition, a table of pixels addressing all pixels and rotation angles
is pre-calculated to reduce computation.
2
The term “affinity matrix” in the original paper was superseded by “similarity matrix”
because the former term was confusing in the field of molecular biology.
62
2.3 Dimension Reduction of Similarity Matrix
For very large numbers of images the calculation of a similarity matrix is
overwhelmed by the vast number of image-pair similarity scores. There are ways to
reduce the dimensions of the similarity matrix, however. For example, random
selection of images is sufficient in most cases for the first step of clustering images.
In addition, a significant portion of the similarity matrix can be estimated. For
example, eliminating odd images is a conventional method, which usually gives a low
correlation value to any of good images. The average correlation to randomly selected
images is useful to rank images and find odd images.
3 Results
3.1 Test with Simulated Images
In order to evaluate the performance of spectral clustering, we first applied it to
simulated projection images for transmission electron microscopy of a protein. A
trimer of blue tongue virus coat protein was chosen as well as a sample data set in
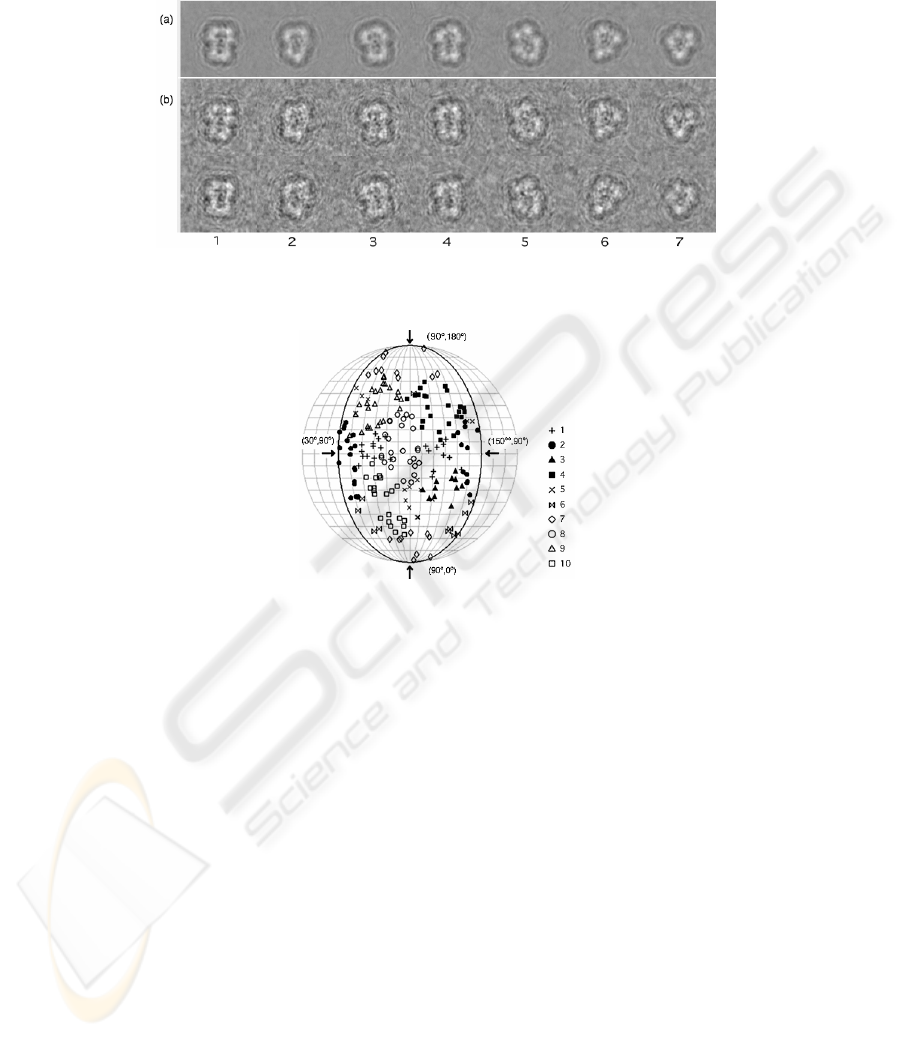
Fig. 2. Clustering result for simulated images of the blue tongue virus coat protein trimer. Seven
groups except three mirror images for 2,3,4 are depicted. (a) average images for each clusters
(b) two sample of images assigned to each clusters
Fig. 3. The distribution of the predefined projection angles (α, β) of individual images in
obtained clusters. With three fold symmetry of this particle, projection angles were limited
between 30 and 150 for
α
63
EMAN software [19]. Volume density was calculated from the atomic coordinates
data entry 1BTV in the protein databank. Using random projection angles, a total of
300 of synthetic images with size 100x100 was processed by the contrast transfer
function filter [5], and random noises were added.
Fig. 2 illustrates the cluster images obtained by averaging images of the clusters
with iterative alignment, and their member images. The common image features
among the cluster images were successfully extracted. Fig. 3 shows a distribution of
cluster members in the projection angle of individual images. Due to the three-fold
symmetry of the molecule, the imposed cluster number 10 seemed to be adequate to
distinguish classes of images. The scaling parameter was set to σ=1/√2 .
3.2 Test with Ribosome Images
Among successful results in application to real data set from transmission electron
microscopy, we demonstrates a result of 70S ribosome by cryo-electron microscopy
[11], which is provided by SPIDER software package [17] including the
three-dimensional volume data reconstructed from the data set; therefore, it allows us
to evaluate the results of clustering performance by comparisons with the projection
of the volume at various angles (Fig. 5c).
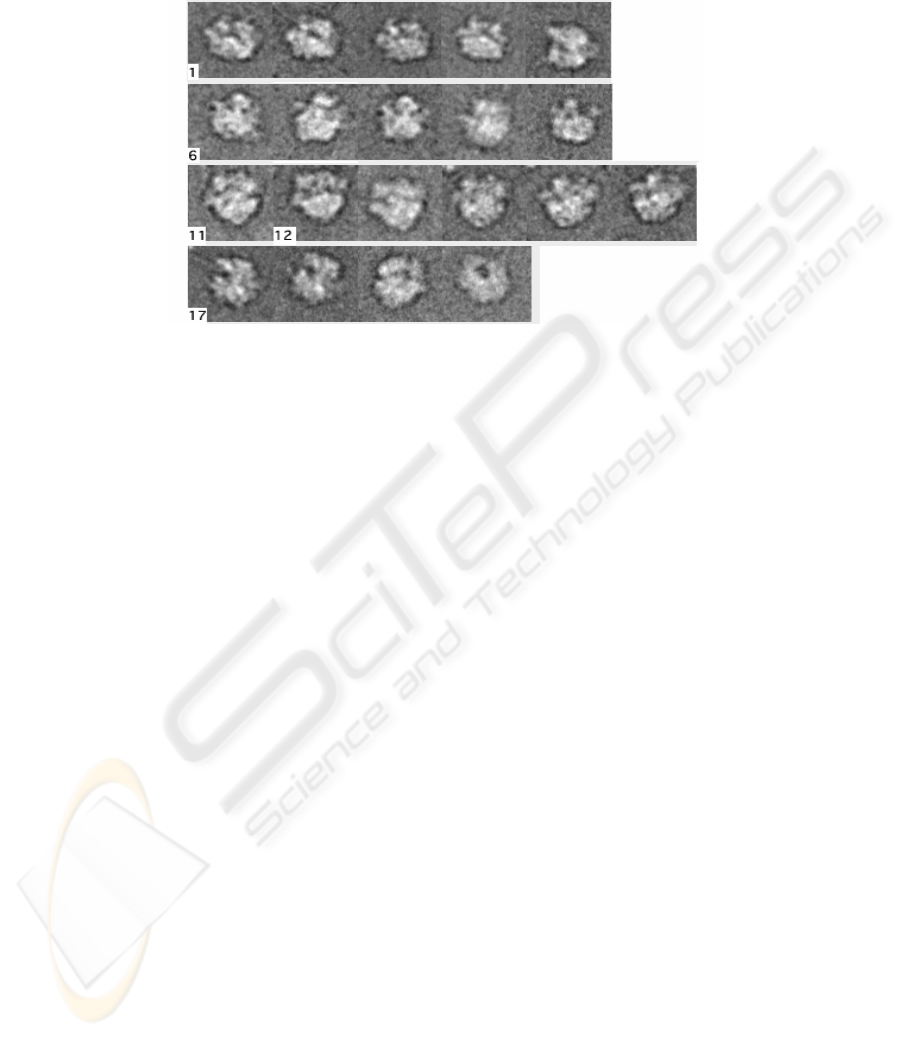
At first, odd images without particle images were eliminated from the 6996 total
images. The result of spectral clustering using 700 randomly selected images with
size 75x75 to form 20 clusters, with the scaling parameter σ=0.5, is illustrated in Fig.
4. The iterative alignment of the obtained cluster images nicely exhibited most
characteristic views of the ribosome published by the original study [11]. Different
values of the scaling parameter and various calculation methods for similarity matrix
were also tested, but results were similar and less distinct.
From raw images of the cluster members, it was difficult for the images to be
Fig. 4. The cluster average images of 70S ecoli ribosome [11] obtained by our spectral
clustering. Orientations of images are roughly adjusted to demonstrates similar views of particle
orientations, The top line lists five images small and globular; the second line showed the
famous portrait of the ribosome; in the third line particles look larger; and the fourth line are the
others
64
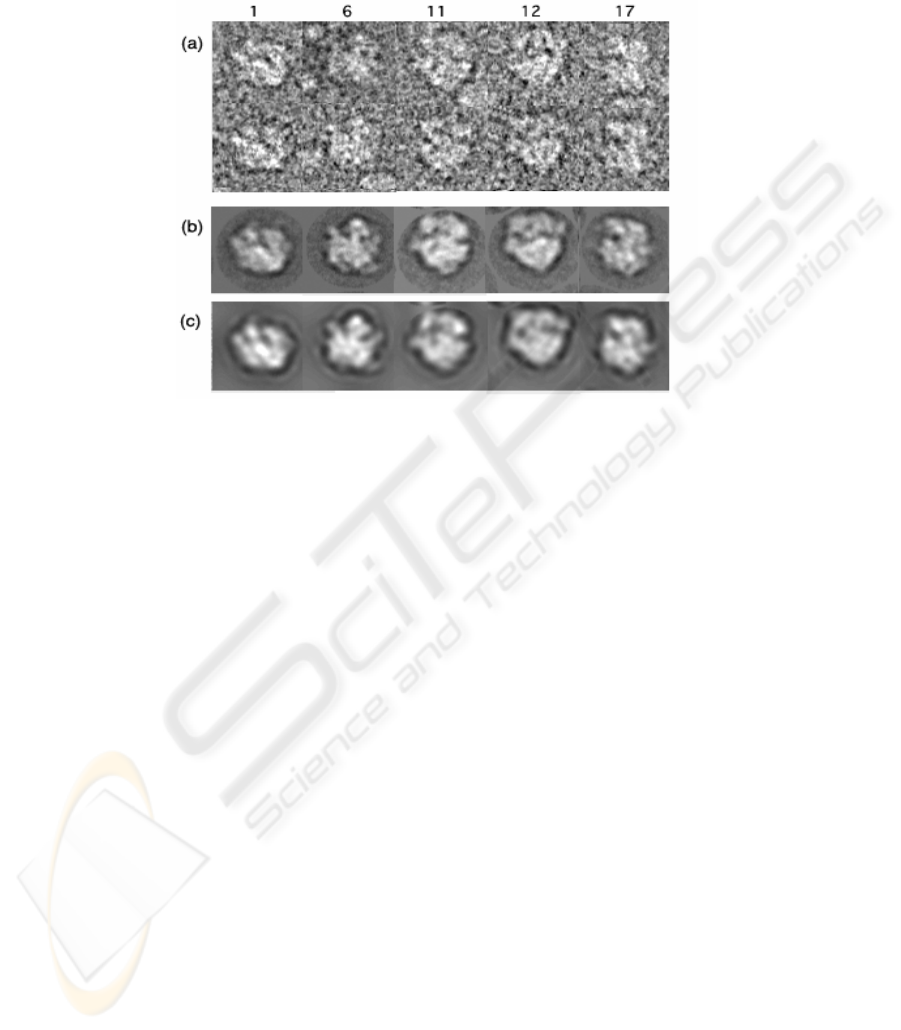
classified by hand (Fig. 5a). In addition, we failed reproduce the original result by
means of traditional method on software package IMAGIC [18]. Using the obtained
cluster images as seed images, similar images were searched in the observed images
by means of multi-reference alignment. The result improved the resolution of the
average image (Fig. 5b). They were consistent to the projection images from the three
dimensional reconstruction (Fig. 5c). Thus, it seems to be satisfactory for the
subsequent three-dimensional reconstruction, indicating that clusters had been
resolved appropriately.
While clustering results are usually checked by the resolution assessment such as
Fourier shell correlation [1], we tried to estimate projection angles of the observed
images from a reference volume of the structure. However, they were too noisy to
confirm their accuracy. The distribution of estimated projection angles showed less
clear separation of clusters than was the case with the previous test (Fig.3). Many
clusters occupied two different regions in the projection angle coordinates, which also
correspond to a pseudo mirror symmetry of the image.
4 Discussion and Conclusion
4.1 Comparison with the Traditional Method
The traditional method of correspondence analysis [12] takes a vector of the image
pixel; then clustering results also provide information about important pixels, which is
used as a mask to improve classification. With this method, small differences between
Fig. 5. (a) Raw images for selected distinct clusters in Fig. 4. (b) The average images refined by
multi-reference alignment against the whole image data set. (c) Corresponding projection
images of the volume data after a final refinement of three dimensional reconstruction
65

projection images were superbly clarified [13]. However, particle images with various
orientations are difficult to align in general, and the subsequent supervised
classification by preferred seed images tends to fail. In this procedure, we need to
align images to produce trends of classification. Moreover, images with different
features, for example, a top view and side views of the molecule, are all compared in
a single alignment, so that it is easy to encounter an artifact image.
We consider that images with different features should be separated in the
traditional framework with multivariate statistic analysis using aligned images. The
features of images should be resolved intrinsically from the context of the image
ensemble. Spectral clustering is an algorithm for addressing this kind of problem.
4.2 Mechanism of Clustering
Spectral clustering only takes into account distances within data sets, once the pixel
data have been used to construct the similarity matrix. One worries that a single
similarity value between two images provides little information as to the optimum
image alignment, and that it can be disturbed by noise. However, on the other hand,
there are other similarity values against other images which support the trend of
clustering from different points of view.
Therefore, once several images are found with very high similarity, and they are
confirmed as different from other images, they obtain a certain magnitude in factor
coordinates to be distinguished as a cluster. The factor space is constructed by the
eigenvector of normalized similarity matrix. The vector is not directly calculated from
pixels of a single image, but defined as the mutual relationship of images within the
ensemble of the data set. Images can be located at a position in space constructed by
cooperation of all image data, ensuring an unsupervised method of clustering. Using
this factor space, the distance of images becomes Euclidian, which is required for
stable convergence in the k-means algorithm [14].
4.3 Techniques in Practical Implementation
In our framework of spectral clustering, the calculation of a similarity matrix requires
extensive computation, which had been a disadvantage in comparison to other
methods [5]. However, our fast implementation allowed performance improvements
in feasible degrees on current microprocessors. For example, it takes about 45
minutes for 700 images of size 75x75 on a 3GHz Pentium4 (Intel Corp.). Besides our
code, there are ways to accelerate computations [15].
The accurate evaluation of similarity is key to the successful clustering of noisy
images, even though the dimension of the similarity matrix is reduced. Besides
random sampling of images, we can rank images so that significant images will
represent the most important part of the whole similarity matrix.
We demonstrated our successful results with spectral clustering for intrinsic
classification of single particle images. To establish a robust software system, the
scaling parameter of spectral clustering and other options need to be optimized.
Moreover, a learning algorithm to automate the parameter tuning [7],[8] is also an
intriguing topic for the future development of our software system [16].
66

Acknowledgement
The authors would like to thank Dr. Patrick Schultz, Dr. Bruno P. Klaholz and Dr.
Dino Moras at IGBMC/University Louis Pasteur for their helpful discussions. We are
greatly encouraged by Dr. Andreas Engel and Dr. Chikara Sato. In this study we used
electron microscopy images of the 70S ribosome, distributed with the software
package SPIDER, with kind permission by Dr. Joachim Frank.
References
1. Frank, J.: Three-Dimensional Electron Microscopy of Macromolecular Assemblies,
Academic Press. (1996)
2. Ueno, Y, Sato, C.: Three-dimensional Reconstruction of Single Particle Electron
Microscopy: the Voltage Sensitive Sodium Channel Structure. Science Progress 84 (2002)
291-309
3. Penczek, P.A., Grassucci, R.A., Frank, J.: Three-dimensional Reconstruction of Single
Particles Embedded in Ice. Ultramicroscopy 40 (1992) 33-53
4. Schatz, M., van Heel, M.: Invariant Recognition of Molecular Projections in Vitreous Ice
Preparations. Ultramicroscopy 45 (1992) 15-22
5. Joyeux, L., Penczek, P.A.: Efficiency of 2D alignment methods, Ultramicroscopy 92 (2002)
33-46
6. Ng, A., Jordan, M.I., Weiss, Y.: On spectral Clustering: Analysis and an algorithm. In
advances in Neural Information Processing Systems 14 (2001)
7. Kamvar, S.D., Klein, D., Manning, C.D.: Spectral Learning. Proceedings of the Eighteenth
International Joint Conference on Artificial Intelligence (2003) pp.561-566
8. Zellnik-Manor, L., Perona, P.: Self-Tuning Spectral Clustering. In advances in Neural
Information Processing Systems 17 (2004)
9. Scholkopf, B., Smola, A., Muller, K.-R.: Nonlinear Component Analysis as a Kernel
Eigenvalue Problem. Neural Computation 10 (1998) 1299-1319
10. van Heel, M.: Classification of Very Large Electron Microscopical Image Data Sets. OptiK
82 (1989) 114-126
11. Penczek, P.A., Grassucci, R.A., Frank, J.: The Ribosome at Improved Resolution: New
Techniques for Merging and Orientation Refinement in 3D cryo-electron Microscopy of
Biological Particles. Ultramicroscopy 53 (1994) 251-270
12. Frank,J. and Voublik,M.: Multivariate Statistical Analysis of Ribosome Electron
Micrographs. Journal of Molecular Biology 161 (1982) 117-137
13. Bruno, P.K., Pape, T., Zavialov, V., Myasnikov, A.G., Orlova, E.V., Vestergaard, B.
Ehrenberg, M., vanHeel, M.: Structure of the Escherichia coli ribosomal termination
complex with release factor 2. Nature 421 (2003) 90-94
14. Asai, K., Ueno, Y., Sato, C. and Takahashi, K.: Clustering and Averaging of Image in
Single-particle Analysis. Genome Informatics, 11 (2000) 151-160
15. Cong. Y., Kovacs, J.A., Wriggers, W.: 2D fast rotational matching for image processing of
biophysical data. Journal of Structural Biology 144 (2003) 51-60
16. Ueno, Y., Takahashi, K., Asai, K., Sato, C.: BESPA: Software Tools for Three-dimensional
Structure Reconstruction From Single Particle Images of Proteins. Genome Informatics 10
(1999) 241-242; on the web http://moonscript.net/bespa/
17. SPIDER software package. http://wadsworth.org/spider_doc/
18. IMAGIC-V software package. http://www.imagescience.de/
19. EMAN software package. http://ncmi.bcm.tmc.edu/~stevel/eman/doc/
67
