
A STUDY OF CLASSIFICATION TECHNIQUES APPLIED TO
CBERS SATELLITE IMAGES
Priscila Andrea da Rocha Severino,
Rossana Baptista Queiroz,
Arthur T
´
orgo G
´
omez,
Luiz Paulo Luna de Oliveira
Masters in Computer Applied, Unisinos University
Avenida Unisinos , 950, S
˜
ao Leopoldo, Rio Grande do Sul, Brazil
Keywords:
Neural Networks, Fractal Dimension, Image Classification, Error Minimization.
Abstract:
In this paper its presented classification methods for identify forests with araucaria angustifolia, using artificial
intelligence and Fractal approach. Studies were made to perform experiments in which could be verified the
suitable of ANNs for classification of CBERS satellite images. However, it was noticed in that classification a
significant error exists. Then, it intends to continuity that study through the incorporation of new techniques of
treatment of the images before the submission to Neural Networks training with the use of error minimization
techniques. When applying the detection of borders in those images, it was noticed that those limits possesses,
visibly, patterns that could be good as additional information for identification of a class. Therefore, it is
supposed that those differences can be quantified by Fractal Dimension calculation, whose definition is going
of encounter with the need of establishing patterns for those borders or limits. Fractal Dimension study
verifies the adaptation of that technique to determine areas that the Neural Networks and the method Maximum
Likelihood doesn’t get to distinguish.
1 INTRODUCTION
The satellite image information can be extracted
through classification of these images. There are vari-
ous classification methods that try through several ap-
proaches to identify with accuracy the information of
each image pixel, classifying them in categories or
classes according to their spectral information. Im-
age classification methods can have different accu-
racy levels, according their approach and parameters
specification. Some of pixel classification methods
that are more used by Geographic Information System
(GIS) are based in statistical inference. In this context
it’s checked if the Artificial Intelligence based tech-
nique is suitable for image classification (W. Gonza-
lez, 2000) (Haykin, 1999) (Feder, 2000). In this paper
it’s presented in its first section a comparative study
between two satellite image classification techniques:
the Statistical Method of Maximum Likelihood (ML)
and an Artificial Intelligence technique, based on the
learning of Artificial Neural Networks (ANNs).Due
to confusion that both methods obtained in some re-
gions, it is proposed in this article the development of
an approach that involves information of image areas
(sets of pixels) instead of pixel-to-pixel information.
In this paper it is showed that he Fractal Dimension
concept can be applied to supply the need of to ac-
complish the identification of the classes in that the
studied methods didn’t get to identify with accuracy.
In section 3, its presented the initial experiments made
in CBERS 2 images, where fractal dimension will be
used to distinguish two interest class.
2 MAXIMUM LIKELIHOOD vs.
ARTIFICIAL NEURAL
NETWORKS
In order to classify an image of the CBERS-1 satel-
lite were used the Maximum Likelihood method and a
method based in the training of Artificial Neural Net-
works, whose detailed description can be seen in other
works.
In the experiments accomplished with those classi-
fiers, it was observed a high rate of success of both
methods for the classes water and forest (the classes
identified were: water, forest, no-forest and Defor-
estation).The Kappa coefficient calculated (0,65 for
MAXVER and 0,64 for the RNAS) is considered sub-
471
Andrea da Rocha Severino P., Baptista Queiroz R., Tórgo Gómez A. and Paulo Luna de Oliveira L. (2005).
A STUDY OF CLASSIFICATION TECHNIQUES APPLIED TO CBERS SATELLITE IMAGES.
In Proceedings of the Second Inter national Conference on Informatics in Control, Automation and Robotics - Robotics and Automation, pages 471-474
DOI: 10.5220/0001187804710474
Copyright
c
SciTePress

stantial for both methods. The classifier based in
Neural Networks presented satisfactory results, com-
pared with the Maximum Likelihood. This indicates
that this method demonstrated that it is suitable for
the classification of satellite images. However it is
observed that both methods tend to confuse the ar-
eas of the deforestation class with the no-forest class.
It is believed that that confusion happen because the
grayscale values of the p
´
ıxeis of those two classes are
very close. For that reason it was started the study of
Fractals as a Minimization Error Technique.
2.1 Study of the Minimization Error
Technique
Through the study and of the accomplished experi-
ments it was verified that the classification neural is
suitable for the images of the satellite CBERS. How-
ever, this classification still has a significant error. It
is intended to give continuity to this study through
the incorporation of new techniques of treatment of
the images before the submission to Neural Networks
training and of techniques for Minimization of Error.
One of these techniques intend to decrease the error
of the classification that happens in the borders, or
transition limits between a class and another. It is ob-
served in the images that some classes present very
defined limits and with different characteristics. If it
is applied border detection in these images is noticed
that those limits have visibly patterns or irregularities
that could be used as additional information for iden-
tification of a class. It is supposed that those differ-
ences can be quantified by Fractal Dimension calcu-
lus (Feder, 2000), whose definition supplies the need
of establishing patterns for those borders or limits.
Fractal Dimension study verifies the adaptation of
that technique to determine areas that the ANNs and
the method ML doesn’t get to distinguish.
2.2 Fractal Dimension
Fractal objects are not measured by length or area.
They are “more” than lines and “less” than a plane.
To measure them, it is used the concept of Fractal Di-
mension. Fractal Dimension is a measure that quanti-
fies the fractal density in the metric space it is defined,
being used for compare it. (Feder, 2000) (Conci,
2004) .
2.3 Fractal Dimension Calculus
In geometric objects (with dimension 1, 2 or 3) it is
used a simple relation among dimension, number of
blocks that is necessary to recover them and the size
of the blocks. It is expressed such as:
d =
log N
log (1/L)
where N is the number of blocks with side L of que
recovering and d is the dimension. In a log-log graph,
this relation is translated as a line. The line’s slope is
the Fractal Dimension d (Feder, 2000) (07, 2004).
2.4 Methodology
For the calculus of the Fractal Dimension of each
class, it was developed an algorithm that obtains the
approximate values of the Fractal Dimension of an
image fragment. The algorithm receives for its in-
put a fragment of satellite image whose its borders
were identified. It is a binary image, just containing
the information of the limits of the interest class. The
input image is splitted in squares (or blocks) every
time minor, counted in number of pixels. For each
square size L, are counted the number of squares ”N”
that contain a piece of the image (it embroiders). The
output generated is a file containing the values of the
logarithm of L and the logarithm of N. At the end, it is
made the linear regression of the data of that file, and
the angular coefficient of that straight line represents
the Fractal Dimension of the image. The experiments
were accomplished with the images classified by ML.
That classified image was submitted to the detection
of borders by the Method Canny (W. Gonzalez, 2000)
in the Software MATLAB. The image was submitted
to the detection of borders several times, modifying
the thresholds of the method Canny, in order to ob-
serve the results with more or less ”noise” of the de-
tection. The initial thresholds, given automatically by
the Software, they were 0,0063 and 0,0156. These
are, respectively Low Threshold and High Thresh-
old (parameters), in other words, the thresholds min-
imum and maximum. After the detection of borders,
they were cut out of the image areas according to the
classes of interest. Those cut out areas were used
as data of entrance of the algorithm of counting of
blocks for Dimens
˜
ao Fractal’s determination. The re-
sults of those initial experiments are presented in the
next item.
2.5 Results of the Experiments with
Fractals
Table 1 illustrates the results obtained for the varia-
tion of the thresholds of the Fractais Dimension of the
classes Not-forest and Deforestation.
ICINCO 2005 - ROBOTICS AND AUTOMATION
472
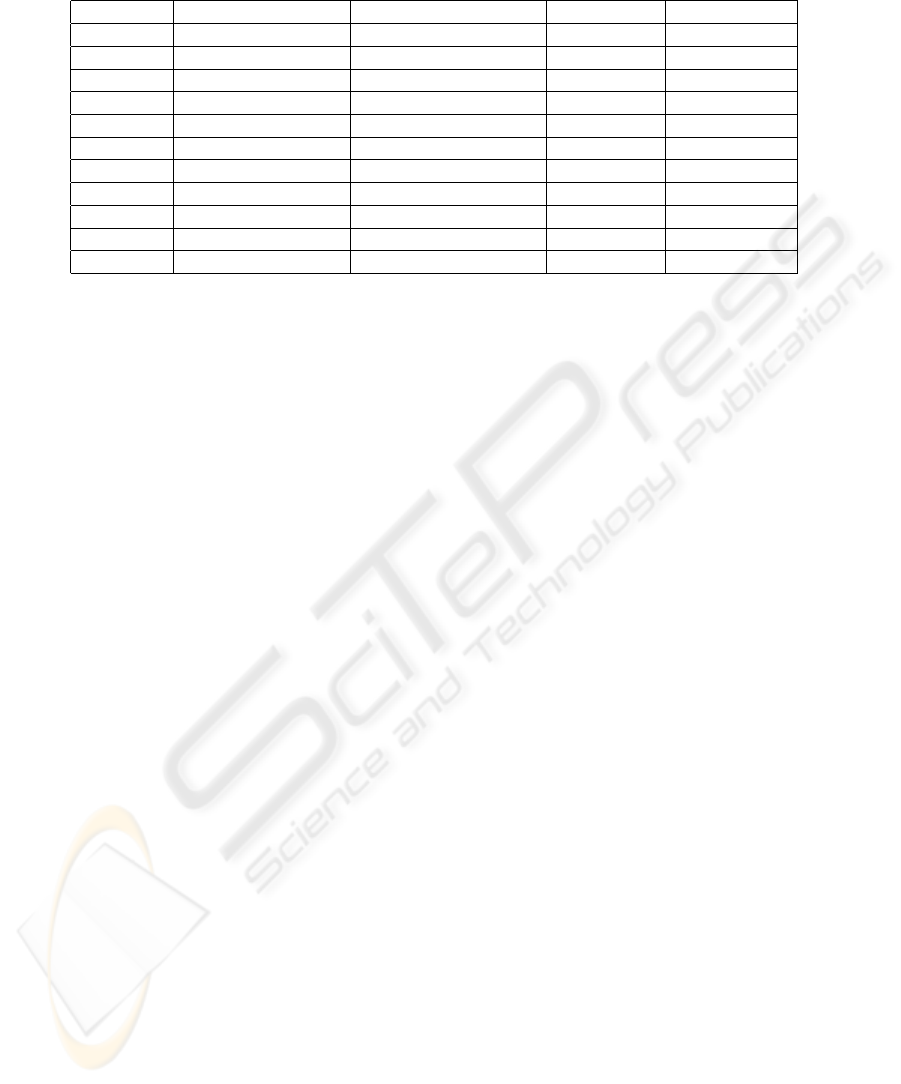
Table 1: Results of Fractal Dimension
SAMPLE LOW TRESHOLD HIGH TRESCHOLD No-Forest Deforestment
1 0.0004 0.0010 1.53709412 1.46204114
2 0.0008 0.0020 1.53537869 1.45986021
3 0.0012 0.0030 1.53410149 1.45847464
4 0.0016 0.0040 1.53297484 1.45847464
5 0.0020 0.0050 1.53107572 1.45847464
6 0.0024 0.0060 1.52993512 1.45847464
7 0.0028 0.0070 1.52984762 1.45847464
8 0.0032 0.0080 1.52922928 1.45847464
9 0.0036 0.0090 1.52905297 1.45847464
10 0.0040 0.0100 1.52799046 1.45847464
11 0.0080 0.0200 1.51408172 1.46
3 INITIAL EXPERIMENTS WITH
TAINHAS IMAGES
The image which were made the experiments de-
scribed in this section referred to the Tainhas region
in Rio Grande do Sul Province, that contains a Na-
tional Preservation Forest (FLONA), with great con-
centration of pinus and araucaria. This image was
obtained by CCD sensor of CBERS-II satellite. The
UTM coordinates of latitute is 551050.191413 and
564050.191413 and longitude is 6735848.537342 and
6752628.537342. The image was submitted to the
classifiers MAXVER and to RNAs, as in the previ-
ous work.They were defined 8 classes, for the iden-
tification of the main elements of the image: Field,
Bare Soil, Road, Araucaria, Pinus, Native, Cloud and
Shadow.
Using the same methodology used with the image
of Rond
ˆ
onia, they were mounted bases for training
and test of both methods. Of the 432 points in that
the field truth is had, became separated in two bases
of 216 points, each a containing 27 examples of each
class.
After the training of each classifier, a confusion
head office is set up on the test base, in order to if
it verifies how many p
´
ıxeis they were classified cor-
rectly and which p
´
ıxeis were designated erroneously
to other classes. The results of those head offices will
be presented in the next section of that paper, that also
shows the result of the classification of the whole im-
age.
3.1 Results of Classification
Starting from the experiments accomplished with the
chosen techniques had been generated the confusion
head offices for both methods. The confusion matrix
shows how much the classifier of images confuses a
class with other.
For this the exits are compared generated by the
methods for each p
´
ıxel and the base of examples,
that it possesses the field truth. The diagonal of the
confusion matrix shows as the method got right, in
other words, the pixels that were classified correctly
in agreement with the field truth.
The Tables 2 and 3 show the result of the confusion
head offices for the methods MAXVER and Neural
Networks, respectively:
4 CONCLUSIONS AND FUTURE
WORKS
In the accomplished study, being used the methods of
ML and Neural Networks, it was verified that both
methods didn’t get to distinguish some areas of the
image; to know, confusion between the classes For-
est of Araucaria and Forest of Pinus. It is observed
in the histograms of the distribution of the grayscale
of the classes, that points certain classes that locate
in the same band of values exist, what hinders to
the nets neurais on top the learning of those infor-
mation. Moreover, in this scope it is considered ad-
vantageous the use of Neural Networks in the classi-
fication of images, once it allows the incorporation of
other types of information on the image, as the use
of techniques that considers dimensions fractals and
even topographical information of the image, being
compared with ML, that consider only the grayscale
of the component bands of the image to be classified.
The use of the fractais intends to supply additional
information them to allow a better identification of
classes in that there is confusion with the classifica-
tion methods used. It is noticed, for the detection of
borders, that their surfaces tend to present different
patterns between the classes. One of the main differ-
ences between an area of deforestation and one of no
forest seen in it is the level of irregularity of their bor-
A STUDY OF CLASSIFICATION TECHNIQUES APPLIED TO CBERS SATELLITE IMAGES
473
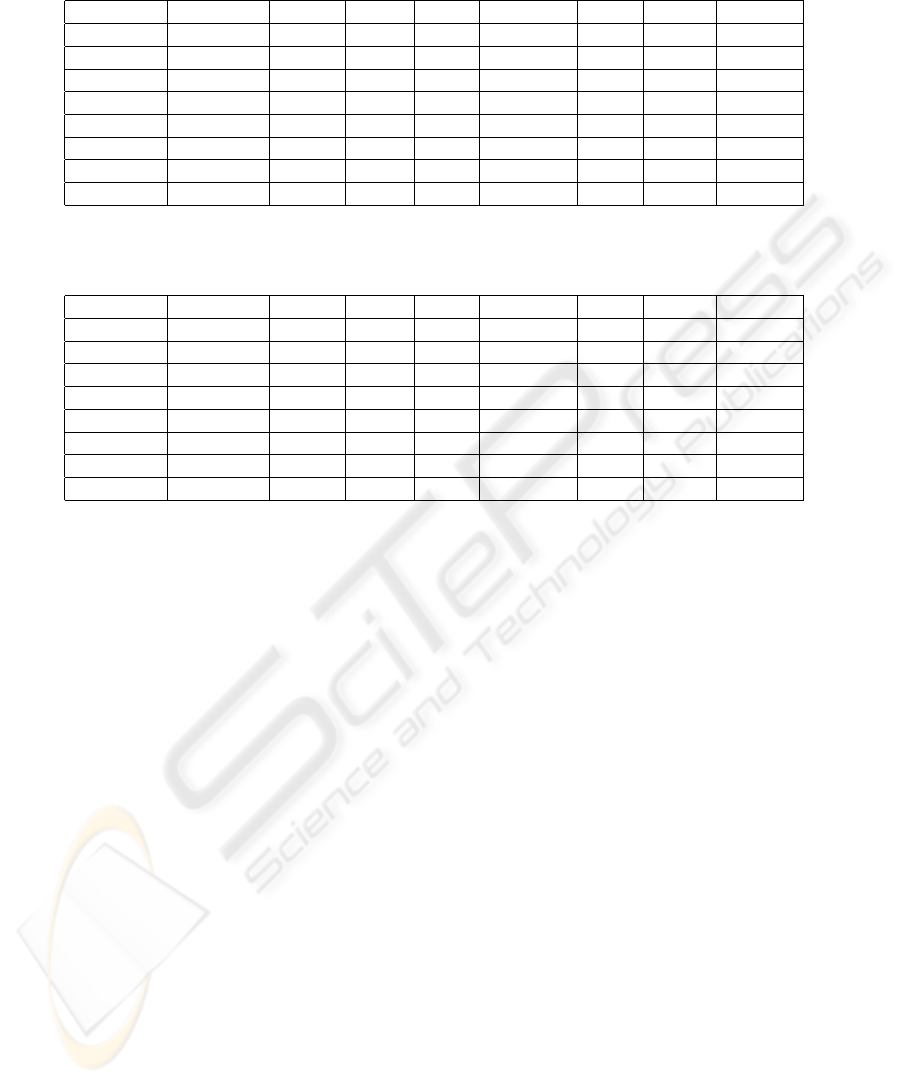
Table 2: Matrix of Confusion of Maximum Likelihood
- Araucaria Native Pinus Field Bare Soil Road Cloud Shadow
Araucaria 0 0 27 0 0 0 0 0
Native 0 27 0 0 0 0 0 0
Pinus 0 0 9 0 0 0 0 18
Field 0 0 8 0 0 19 0 0
Soil 0 8 0 0 19 0 0 0
Highway 0 0 0 1 0 26 0 0
Cloud 0 0 0 0 0 0 27 0
Shadow 0 1 0 0 0 0 0 26
Table 3: Matrix of Confusion of Neural Networks
- Araucaria Native Pinus Field Bare Soil Road Cloud Shadow
Araucaria 0 0 27 0 0 0 0 0
Native 0 27 0 0 0 0 0 0
Pinus 0 0 20 0 0 0 7 0
Field 0 0 9 9 9 0 0 0
Soil 0 0 0 0 27 0 0 0
Highway 0 0 0 9 0 18 0 0
Cloud 0 0 0 0 0 0 27 0
Shadow 0 0 0 0 1 0 0 26
ders. In fact, the areas deforested by the man tend to
be more regularly delimited than those of savannah
(no forest). In relation to the image of Tainhas, it is
known that exist areas in which araucarias present like
capons, while the pinus, that they were inserted in the
area through the human action, have a more poligo-
nal aspect. In spite of the possibility of the borders
themselves don’t constitute in fractals, in the strict
sense of the term, it is noticed that the use of estimates
of dimensions fractals can accuse such difference, re-
sulting in larger values for savannahs and smaller for
deforestations (due to the human action). That was
verified in the results obtained until the moment. The
information regarding dimension fractal of the classes
will be applied in the improvement of the accuracy
in the identification of areas of interest together with
ML and ANNs, constituting a hybrid model of clas-
sification of satellite images. It is waited through this
work that is developed a robust classifier that it sup-
plies the needs of the user’s accuracy, reducing the
parametrization difficulties and deficiencies found in
the conventional methods of classification of images
by pixel.
REFERENCES
(2004). C
´
alculo da Dimens
˜
ao Fractal.
http://cftc.cii.fc.ul.pt/ICES/manual/2/calcula-
dimensao.htmlintro.
Conci, A. (2004). Gometria Fractal.
http://www.caa.uff.br/ aconci/Fractais.html.
Feder, J. (2000). Fractals. Plenum Press, S
˜
Ao Paulo.
Haykin, S. (1999). Redes Neurais - Princ
´
ıpios e Pr
´
atica.
Bookman, Porto Alegre, 2nd edition.
W. Gonzalez, R. W. (2000). Processamento de Imagens
Digitais. Edgard Bl
¨
ucher, S
˜
A£o Paulo.
ICINCO 2005 - ROBOTICS AND AUTOMATION
474
