
POSE ESTIMATION OF MOBILE MICROROBOTS IN A
SCANNING ELECTRON MICROSCOPE
A cross-correlation based approach using ROI´s
Torsten Sievers, Sergej Fatikow
Division of Microrobotics and Control Engineering, University of Oldenburg
Uhlhornsweg 84, 26111 Oldenburg, Germany
Keywords: mobile microrobots, image processing, scanning electron microscopy.
Abstract: In this paper, current research towards an automated micro/nano handling station using mobile microrobots
is presented. Mobile microrobots with piezo slip-stick actuation and more than one degree of freedom
mostly don't have internal pose sensors; therefore a global sensor is needed. This paper focuses on the pose
estimation of the mobile microrobots. One possibility for fast pose estimation is the application of video
cameras as global sensors. For pose estimation with accuracy even in the nanometer range high resolution
sensors are necessary. In consideration of resolution, image acquisition time and depth of focus a Scanning
Electron Microscope (SEM) is a powerful sensor for high resolution pose estimation. But the use of a SEM
makes high demands on the image processing. High update rates of the pose data for the robot control
enforce a short image acquisition time of the SEM images. Hence the image noise increases, because frame
averaging or averaging of the detector signal is time consuming. This paper presents a method to calculate
the x,y position and the orientation of a micro object in a strongly noised SEM image stream with cross-
correlation in real-time. To make real-time pose estimation possible, only a region-of-interest (ROI) is
correlated with the target pattern. The SEM is almost predestined to work with ROI’s, because the scan area
of the electron beam can be chosen arbitrarily.
1 INTRODUCTION
Micro- and nanohandling covers the field of
handling objects with sizes in the range of µm, sub-
µm and even a few nm. The most important
applications today are microassembly,
semiconductor technology, nanotechnology, material
research, medicine and biology. Within the last years
a trend towards the automation of nanohandling
processes emerged (Nakajima et al, 2004, Yang et
al, 2003). The nanohandling station that is currently
being developed aims at performing diverse
nanohandling operations in the vacuum chamber of
SEM by several mobile microrobots. In the next
sections an experimental set-up as well as the visual
sensor system architecture for an SEM-based
nanohandling station is presented. The focus will be
the image processing algorithms that determine the
poses of the mobile microrobots. The pose
information is directly used as visual feedback for
telemanipulation or by the control system of the
workstation (Garnica et al, 2003).
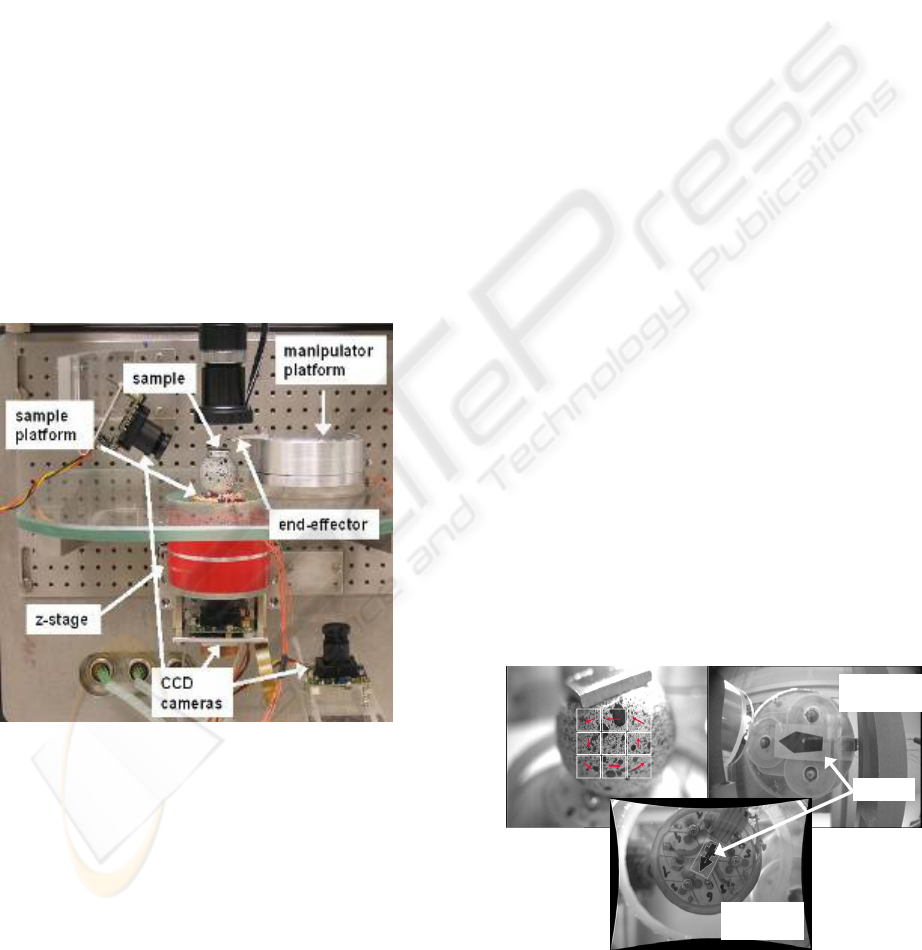
2 EXPERIMENTAL SETUP
The setup of the mobile microrobot-based
nanohandling station, which has been used, is
depicted in Fig. 1. For an easy handling, the setup is
mounted on a removable SEM door for LEO 1450.
In detail, the setup mainly consists of mobile
microrobots, a linear z-stage and a visual sensor
system consisting of cameras and the SEM. The
concept of the presented setup is that a mobile
platform works as sample holder to move a sample
in the correct pose in the field of view of the SEM.
A second mobile platform carries micro/nano tools
like micro grippers or AFM tips for the manipulation
of the sample. In (Kortschack et al, 2004) the
functionality and characteristics of the mobile
193
Sievers T. and Fatikow S. (2005).
POSE ESTIMATION OF MOBILE MICROROBOTS IN A SCANNING ELECTRON MICROSCOPE - A cross-correlation based approach using ROI´s.
In Proceedings of the Second International Conference on Informatics in Control, Automation and Robotics - Robotics and Automation, pages 193-198
DOI: 10.5220/0001178201930198
Copyright
c
SciTePress
platforms has been described. The high-level control
architecture and low-level control algorithms are
presented in (Hülsen, 2004).
The sample holder consists of a mobile platform
moving on a glass plate. This glass plate can be
moved in z-direction via a piezo actuator
(PiezoMotor™) with a traveling range of 2 cm. For
the pose estimation of the z-position the optical
sensor Mercury 3000V from MicroE™ has been
used. Both mobile platforms (stage platform with
sample holder and manipulator platform) are built up
on the stick slip principle and have three degrees of
freedom – two translational and one rotational.
Additionally, on top of the stage platform
another platform has been mounted upside-down.
However, instead of using it as a translational stage,
a metal sphere is put on the ruby spheres. This
sphere serves as the sample holder. By applying a
saw-tooth voltage to the piezo discs, the upper
platform is able to rotate the sphere around three
axes, whereby only two rotational movements are
allowed by the control software.
Figure 1: Setup of the mobile microrobot based
nanohandling station (outside the SEM)
In summary, the whole stage has seven degrees
of freedom, whereby one rotational degree is
blocked by the control software.
To begin a manipulation process, the sample to
be manipulated and the manipulator have to be
positioned in field of view of the SEM. First, the
sample is positioned by the sample platform, and
then the manipulator is positioned in the center of
the SEM image. The positioning tasks for both
platforms are divided into the two sub task coarse
and fine positioning. Coarse positioning is carried
out with visual feedback from CCD cameras (sec. 3)
and fine positioning by processing SEM images
(sec. 4).
3 VISUAL SENSORS
Because of the fact that the mobile platforms have
no internal position sensors analogue CCD cameras
with PAL resolution (768x576 pixels) have been
used to determine a global pose (x, y, φ). Each
camera is equipped with an IR-LED ring light.
Because the secondary electron detector of the SEM
is sensitive to light in the visual spectrum infrared
LEDs are necessary. One approach for the
automated coarse positioning of a mobile microrobot
has been described in (Fatikow et al, 2004).
Pose estimation of the micro robot has been
achieved by a small marker placed onto the
underside of the robot, which will be tracked (Fig.
2). The estimated poses of the micro robot are
represented as a string and sent to the control PC by
TCP/IP communication protocol. The approach
described in (Fatikow et al, 2004) used the
Geometric Model Finder (GMF) of the Matrox
Imaging Library 7.5 (MIL) to determine the
orientation of the mobile platform
(www.matrox.com). With this algorithm a resolution
better than 0.5 mm is possible, which will be
sufficient to position the microrobot’s end-effector
into the scan-field of the SEM, if the magnification
of the SEM is low. The algorithm allows a sensor
update rate of 15 poses per second, by using a
standard PC (2.6 GHz) (Fatikow et al, 2004).
marker
manipulator
platform
sample
platform
marker
manipulator
platform
sample
platform
Figure 2: View from the CCD cameras (top left: sphere,
top right: manipulator platform, bottom: sample platform)
ICINCO 2005 - ROBOTICS AND AUTOMATION
194
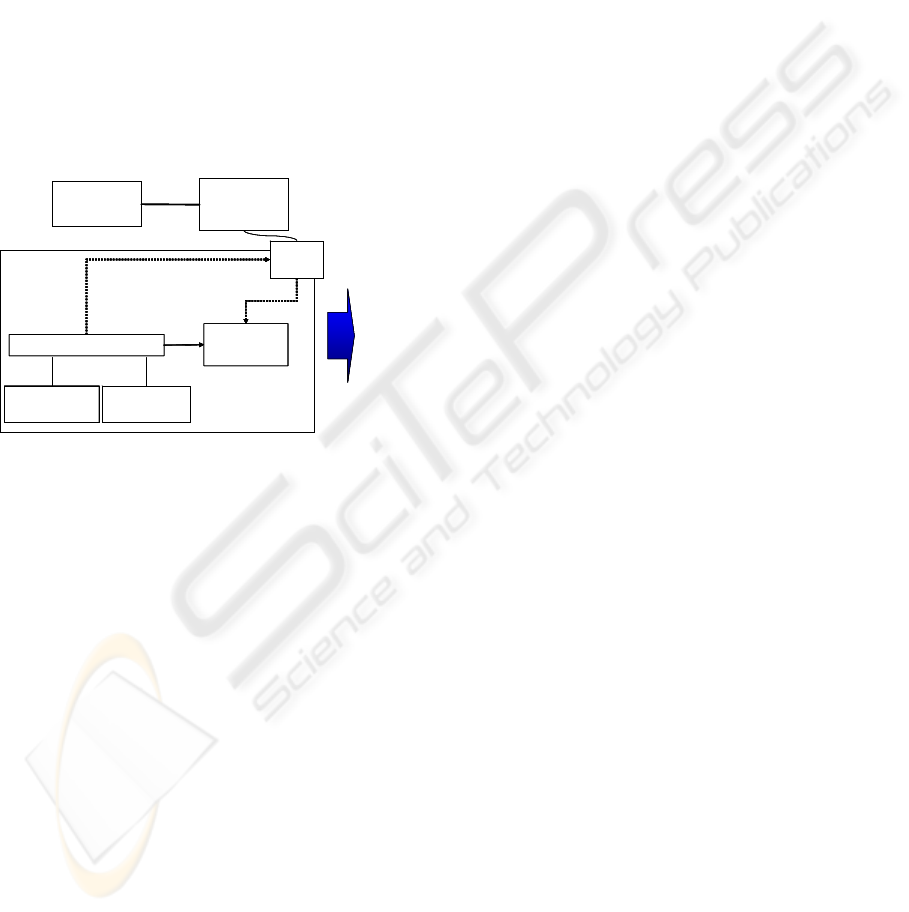
The requirement for live processing of SEM
images is a fast access to the digitized images. We
are using two SEM´s in our lab, a Zeiss DSM 950
and a LEO 1450. The Zeiss DSM 950 has no built-in
digital image acquisition. Thus we are using
additional hardware from point electronic™ with an
external beam control and digital image acquisition
via a PC interface (www.pointelectronic.de) (Fig. 3).
Although the LEO 1450 is equipped with a digital
image acquisition the point electronic hardware is
used, too, because no software interface for directly
accessing the images and controlling the electron
beam is delivered by the SEM vendor. A second
advantage of using the point electronic hardware for
both devices is that the developed software doesn't
have to be SEM specific.
x,y,φ
RAM
SEM
control lib.
Image
Acquisition
Hardware
USB
2.0
Application
beam control
images
image proc.
lib.
SEM
x,y,φ
RAM
SEM
control lib.
Image
Acquisition
Hardware
USB
2.0
Application
beam control
images
image proc.
lib.
SEM
RAM
SEM
control lib.
Image
Acquisition
Hardware
USB
2.0
Application
beam controlbeam control
imagesimages
image proc.
lib.
image proc.
lib.
SEM
Figure 3: Setup of the image processing system
4 POSE ESTIMATION WITH SEM
IMAGES
4.1 Region of interest
Due to the fact that the control system needs the
position and orientation e.g. of an end-effector, the
scan speed of the SEM has to be well above 1 frame
per second. Approximately 10 poses per second is a
good data rate for the control system. However, this
leads to low image quality and noisy images.
Therefore a trade-off between image quality and
scanning speed is looked for. A good solution to find
such a trade-off is the definition of a Region of
Interest (ROI), which can be done with the digital
SEM hardware with software interface from point
electronic. Using ROI's is common in image
processing especially in visual tracking to decrease
computational costs, but with a SEM as sensor
The advantage of the ROI is that the electron
beam of the SEM scans only a small part of the
whole scan field. This leads to a higher scan speed,
whereby the image acquisition time can be
decreased. In addition, the ROI can be defined in a
way that only the interesting object is in the ROI.
This leads to a matching of the target without any
miss matches. If the target is moving, then a new
ROI will be defined around the centre of gravity of
the next pattern match. Only in the worst case that
the target can’t be determined, the whole scan field
will be used again. With this technique the
processing speed and the robustness of the algorithm
can be improved.
4.2 Cross-correlation
Powerful methods for object detection and position
estimation in extremely noisy images are correlation
techniques. Detailed work regarding correlation
based techniques for processing noisy images and
many applications are presented in (Goudail,
Réfrégier, 2003). In this paper the application of
correlation to SEM images is described.
Correlation is a very useful method to find
objects in extremely noisy SEM images. The
disadvantage is a high computational cost, which
will increase with the image resolution. If
orientation and scale of the target object are needed
the computational cost will increase further. Hence,
there are limits when applying correlation to real-
time object tracking. With the use of ROI´s, as
described in the previous chapter, the performance
drawback can be overcome. A solution for the
estimation of the orientation is presented in the next
chapter.
POSE ESTIMATION OF MOBILE MICROROBOTS IN A SCANNING ELECTRON MICROSCOPE - A
cross-correlation based approach using ROI´s
195
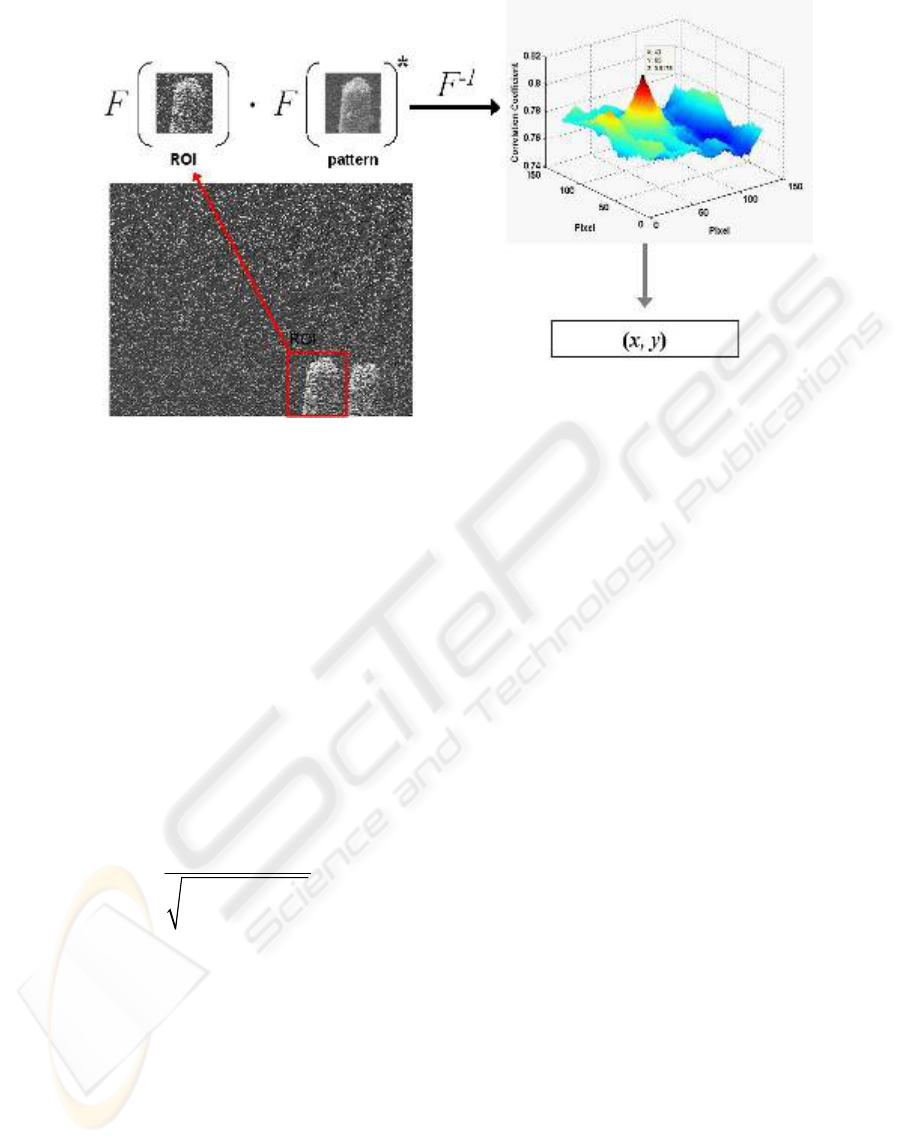
Figure 4: SEM image (640x480 pixels) of the gripper with an acquisition time of 0.1s (lower left). The pattern is an average
of 10 images with a size of 128x128 pixels. The gripper is described in (Mølhave et al., 2004)
The result of a cross correlation between two
images is a matrix which shows possible
displacements of similar input images. Cross
correlation is defined as (Weisstein):
1*
CIPF
−
⎡⎤
=⋅
⎣⎦
Where I is the Fourier transformed of the input
image i and P
*
is the complex conjugated of the
Fourier transformed of the target pattern p. F
-1
denotes the inverse Fourier transformation and C the
correlation coefficient matrix. To get the correlation
coefficients in the range [-1...1] normalization is
needed:
22
k,l k,l
k,l k,l
1
N
ip
=
⋅
∑∑
This leads to the normalized cross correlation
matrix:
N
CCN
=
⋅
If the maximum value of C
N
is equal to 1, both
images are completely correlated. The combination
of using cross correlation with ROI’s is depicted in
figure 3.
If the maximum exceed a predefined threshold,
the position of the maximum peak of the correlation
matrix defines the position of the gripper.
4.2.1 Orientation estimation
The estimation of the orientation of the gripper with
cross correlation is more complex. One possibility is
correlating the input ROI with rotated patterns. Thus
the time consumption for the pose estimation will
increase strongly. To limit this disadvantage the
maximum number of correlations per slope cycle has
been restricted. Therefore a pattern vector has been
generated with 360 components, each rotated by one
degree. For every slope cycle only three adjacent
patterns (p
j-1
, p
j
, p
j+1
) will be selected from the
pattern vector and are correlated, where j denotes the
angle. If the starting orientation is known, the
pattern p with the same orientation and the patterns
with +1° and -1° are chosen. For every slope cycle
the pattern with the maximum correlation will be
estimated and set as p
j
. Subsequently the new p
j-1
and p
j+1
are selected. The flow diagram of the
algorithm is depicted in figure 4. To detect rotations
with more than 1 degree between two frames the
orientation estimation is repeated a few times for the
current frame. If the cross-correlation coefficient for
p
j+1
(respectively p
j-1
) is smaller than p
j
, the correct
orientation is estimated.
ICINCO 2005 - ROBOTICS AND AUTOMATION
196
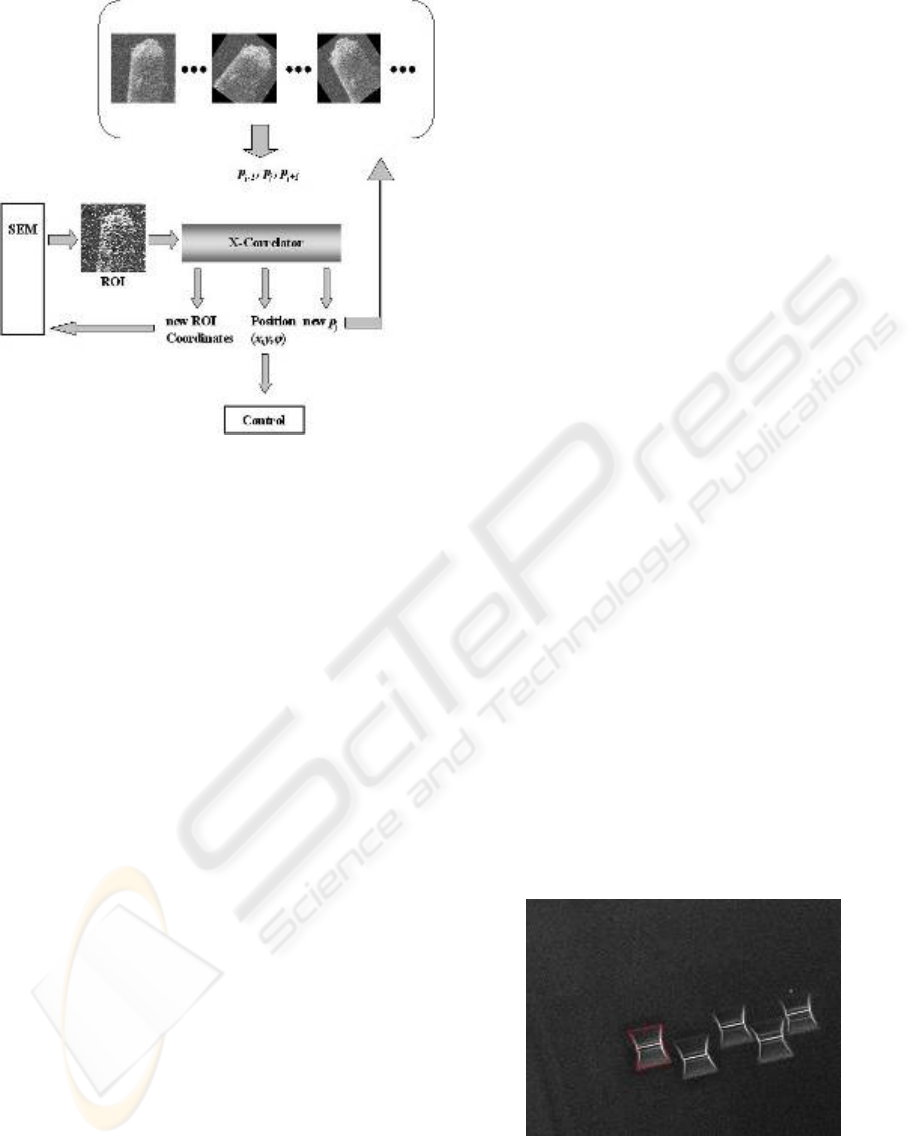
Figure 5: Cycle of the pose estimation algorithm using
cross correlation
The limit of this approach is that only continuous
orientation changes can be measured. Orientation
changes between two frames with more than a few
degrees cannot be tracked fast enough. For the pose
estimation of an end-effector mounted on a mobile
platform, this drawback is negligible because only
slow rotations are possible.
4.2.2 Start ROI
To start the tracking, the target pattern has to be
found in the full size SEM image. The starting
problem can be solved by using the algorithm
described above. Therefore, the SEM image is
separated into sub images, each with the same size
as the pattern. Experiments carried out so far have
shown that an overlap of the sub images isn't
necessary. Generally, an overlap of some pixels is
meaningful to make sure that the correct target will
be found. For every sub image and every component
of the orientation pattern vector the cross-
correlation has to be calculated. The position of the
maximum of the sub image with the highest
correlation is set as the centre of the start ROI.
The disadvantage of this approach is the high
computing time, which depends on the size of the
image and the pattern. One possibility to speed up
the estimation of the start ROI is image resizing.
Decreasing image and pattern by a factor 8, for
example (640x480 → 80x60 pixels and 128x128 →
16x16 pixels), results in an approximately 8 times
faster ROI estimation. To reduce the number of
calculations the number of components of the
pattern vector has been reduced to 18. The accuracy
loss has been compensated by one succeeding cross-
correlation calculation with full resolution (ROI and
pattern with 128x128 pixels) and complete pattern
vector. Another possibility is a hierarchical search in
the frequency domain. But if only one resize step is
needed the performance difference is negligible
5 RESULTS
The algorithm has been tested with two micro
objects, a gripper and TEM-lamellae. The gripper is
mounted on the manipulator platform and the wafer
with the lamellae is fixed on the sample platform. In
the presented case the frame rate of the SEM is set to
11 fps (frames per second) with an image resolution
of 640x480. Frame averaging is switched off, thus
all frames have been captured with the worst quality.
The 128x128 pixel patterns have been generated by
averaging 10 frames. In figure 3 an image of the
gripper can be seen. The TEM-lamellae is depicted
in figure 5. The captured sequence is a typical visual
servoing task for mobile microrobots of the
nanohandling cell, presented in Sec.1. First, a micro
or nano object has to be positioned to a predefined
pose in the SEM image automatically. Accordingly,
the manipulator tool has to be positioned close to the
object. Because the accuracy of the coarse
positioning is too low, three SEM magnification
steps with different patterns will be used. Changing
the magnification of the SEM doesn't lead to a break
in the automation process, because the LEO 1450 is
equipped with a remote control via RS232.
Figure 6: TEM-lamellae with box dimension of 18µm x
10µm
The accuracy of the pose estimation is 1 pixel
for the x,y position, which means approximately 40
POSE ESTIMATION OF MOBILE MICROROBOTS IN A SCANNING ELECTRON MICROSCOPE - A
cross-correlation based approach using ROI´s
197

nm in real world coordinates. The accuracy of the
orientation estimation is 1°. The computation speed
depends strongly on the pattern size and the number
of cross-correlations per frame. In the presented case
the average number of cross-correlations per frame
is between 3 and 4. With a standard PC (P4, 2.6
GHz), the computation time is 0.02 s for one pose
estimation without orientation calculation and
approximately 0.07 s with orientation. With a SEM
frame rate of 10 fps real-time capability has been
demonstrated. Only for the first frame 0.8 s are
needed to determine the start ROI.
The acquisition time for one pixel is 250 ns.
Therefore the minimum image acquisition time for a
128x128 ROI is about 4.1 ms. The user can chose
between a high frame rate with low image quality
and a slower frame rate with better image quality. In
general, one should adopt the frame rate to the
processing time of the pose estimation algorithm.
Therefore an adaptive scan speed has been
implemented.
The disadvantage of the cross correlation
approach is that changes of the targets shape are
hard to recognize. For every magnification of the
SEM, the pattern has to be adapted, because the
scale of the target changes with the magnification. If
only few magnification steps are used this problem
can overcome by using additional patterns. A more
serious problem is shape variation by deformation,
e.g. while a gripping process.
6 CONCLUSION
The real-time pose estimation of micro- and
nanoobjects inside a SEM image stream requires
image processing algorithms with high robustness
against noise. Cross correlation is a powerful
method to overcome this problem. The disadvantage
that computation time is very high can be
compensated by using ROI’s. Here an advantage of
the image acquisition process of SEM’s can be used.
Because only a small region will be scanned, one
can choose between high image acquisition speed
and high image quality in comparison with a full
size scan. Overall this leads to real-time capability
for the sensor system. The presented approach
enables automatic positioning of mobile microrobots
with nanometer resolution, which is a further step
towards automatic nanohandling.
ACKNOWLEDGMENT
This paper is based on research work supported by
the European Union; project ROBOSEM (GRD1-
2001-41864).
REFERENCES
Yang, G., Gaines, J. A., Nelson, B.J., 2003. A supervisory
wafer-level 3D microassembly system for hybrid
MEMS fabrication, Journal of Intelligent and Robotic
Systems, nr. 37, Kluwer Academic Publishers, pp. 43-
68
Nakajima, M., Arai, F., Dong, L., Nagai, M., Fukuda, T.,
2004. Hybrid Nanorobotic Manipulation System
inside Scanning Electron Microscope and
Transmission Electron Microscope, Proc. of IEEE/RSJ
Int. Conference of Intelligent Robots and Systems, pp.
589-594
Garnica, S., Hülsen, H., and Fatikow, S., 2003.
Development of a Control System for a Microrobot-
Based Nanohandling Station, Proc. of 7th Int. IFAC
Symp. on Robot Control (SYROCO), Wroclaw,
Poland, pp. 631-636
Kortschack, A., Fatikow, S., 2004. Development of a
mobile nanohandling robot, Journal of
Micromechatronics, Volume 2, Nr. 3, pp. 249 – 269
Hülsen, H., 2004. Design of a fuzzy-logic-based
bidirectional mapping for kohonen networks. In Proc.
Int. Symposium on Intelligent Control (ISIC’04),
Taipei, Taiwan.
Fatikow, S. et al., 2004. Versatile Nanohandling Robot
Cell in a Scanning Electron Microscope, 12th
Mediterranean Conference on Control and
automation.
www.pointelectronic.de
Goudail, F., Réfrégier, P., 2003 Statistical Image
Processing Techniques for Noisy Images – An
Application-Oriented Approach, Kluver Academic /
Plenum Publisher.
Weisstein, E.W. "Cross-Correlation Theorem." From
MathWorld--A Wolfram Web Resource.
http://mathworld.wolfram.com/Cross-
CorrelationTheorem.html
Mølhave, K., Hansen, T. M., Madsen, D. M. and Bøggild,
P., 2004. Towards Pick-And-Place Manipulation of
Nanostructures, Journal of Nanoscience and
Nanotechnology, 4, 279-282
ICINCO 2005 - ROBOTICS AND AUTOMATION
198
