
MODELING AND ANALYSIS OF REDUNDANCY IN REMOTE
MONITORING AND CONTROL SYSTEMS VIA PETRI NETS
Cheng Guo
Software School, Tsinghua University. 12#121,Tsinghua University, Beijing 100084 ,P.R.China
Zheng Qin
Software School, Tsinghua University.
Software School,Tsinghua University, Beijing 100084 ,P.R.China
Keywords: System design, Redundancy, Remote monitoring and control system, Petri nets.
Abstract: This paper presents techniques that enable the modeling and analysis of redundancy in remote monitoring
and control systems. Hardware redundancy and software redundancy are both implemented in the proposed
system organically. To model and analyze the redundancy, a formalism to derive Petri net (PN) model from
state transition diagram is constructed and the monitor compatible condition is considered. Software
redundancy mechanism in manager side is also modeled based on PN. This approach makes redundancy
modeling and analysis possible in terms of well-developed concepts and methods in PN theory. By the
analysis of the PN model, designers can obtain reliable and effective measures that would compare different
schema in the early phases of design, and select the best one. Our approach is illustrated and validated on
STPNPlay by an example.
1 INTRODUCTION
The remote monitoring and control system is
extremely important for most automated
manufacturing processes in large scale and long-
distance distributed system. It receives signals from
sensors, corresponds to exceptional situations, starts
up emergent processes and announces alarms. In the
past years, rapid development of Internet technology
has witnessed monitoring systems changing from
centralized form to multi-centre and distributed
form. Lots of approaches have been proposed to
monitor automated manufacturing systems from a
long distance. However, monitoring and control
systems are becoming more and more complicated
to guarantee its reliability, as more devices are
networked in automated manufacturing systems.
Using redundant devices is a widely adopted method
to ensure the quality when designing high assurance
remote monitoring and control systems. That is to
say, an effective redundancy structure is crucial to
achieve a high–quality system.
This paper presents an effective modeling
approach to
analyze redundancy schemes with
following benefits.
1. Both hardware and software redundancy
mechanism
are modeled in a generalized method.
2. By formalism and monitor compatible condition,
th
e modeling approach is built up with well-
developed concepts.
3. PN theory offers many effective methods to
eval
uate the performances of our model.
4. The approach presented in this paper can be
p
erformed in an automatic way.
5. Designers can obtain reliable and effective
measures in the early design phases to compare
different schemes and select the best one.
State transition diagrams are used to illustrate
basi
c components’ functions of both the agent side
and the manager side. Then, corresponding PN
models are proposed to use configurable graphical
interface and mathematical analysis methods of PN
to verify the redundancy structure before the
implementation of the system. During the design
process, the PN models are analyzed by performing
algorithms which statistically assume probabilities
of systems assurance at different levels.
The paper is structured as fo
llows. In section 2 we
discuss some related works. Section 3 describes the
redundancy schemes in remote monitoring and
37
Guo C. and Qin Z. (2005).
MODELING AND ANALYSIS OF REDUNDANCY IN REMOTE MONITORING AND CONTROL SYSTEMS VIA PETRI NETS.
In Proceedings of the Second International Conference on Informatics in Control, Automation and Robotics - Signal Processing, Systems Modeling and
Control, pages 37-44
DOI: 10.5220/0001175700370044
Copyright
c
SciTePress
control systems. The modeling and analysis
approach is outlined in section 4. Section 5 presents
an illustrative example. Then the paper is closed by
a short conclusion.
2 RELATED WORKS
Remote monitoring and control systems can be
usually divided into two components. One is agent
side and the other is manager side. Currently, more
and more agent side devices are embedded with web
server software to be conveniently monitored by
manager side devices, using web browsers through
the hypertext transfer protocol.
Petri nets (PN), first introduced in 1963, is wildly
used to model and analyze systems with parallel and
concurrent activities. As a graphical-mathematical
tool, several new types of PN have been developed
to analyze different properties of systems in the past
forty years. Classical PN offers methods to
qualitatively analyze system properties such as
reachability, boundedness, liveness, and
conservativeness. Timed Petri nets (TPN) is used to
quantitatively analyze the performance properties.
By changing the numerical variables in TPN into
stochastic ones to form a Stochastic Petri nets
(SPN), Markov Chain Method can be used to
analyze performance properties of systems, which
offers more analytical ways. PN has not only precise
semantics but also powerful analytical methods.
Moreover, many approaches have been proposed to
analyze various systems via PN automatically. This
is why, in this paper, PN is adopted to obtain the
analyzable models of redundancy schemes for
remote monitoring and control systems. With this
approach, both qualitative and quantitative analysis
can be applied to achieve reliable long distance
distributed systems.
3 REDUNDANCY IN REMOTE
MONITORING AND CONTROL
SYSTEMS
Generally, redundancy can be implemented in three
aspects. The first is hardware redundancy which
configures multi-backup for key hardware to
enhance system’s reliability. The second is software
redundancy. By implementing some fault toleration
software, systems can automatically return to the
normal status from the abnormal one. And the third,
information redundancy, adds to system some
necessary data to enhance its reliability. Its merits
are lower redundancy requirements, unified
treatment of information bit and checkout bit.
In general, the more the redundancy backup is
implemented, the higher the system’s reliability and
cost is, and the more complicated the system’s
architecture is. Therefore, redundancy should be
used properly in the weak parts to find a tradeoff
between system reliability and its cost.
In remote monitoring and control systems,
hardware redundancy is often applied to make the
system work properly without any interruption even
when a fault happens. While software redundancy is
the most common way to enhance reliability of
distributed software. In our work, hardware
redundancy and software redundancy are
implemented organically. In the agent side,
hardware redundancy is the solo choice since basic
and major components such as sensors, motors, and
programmable logic controllers do not support high-
grade software programming. Whereas, both
hardware and software redundancy can be adopted
in the manager side due to the advanced capability
of the management stations, often computers.
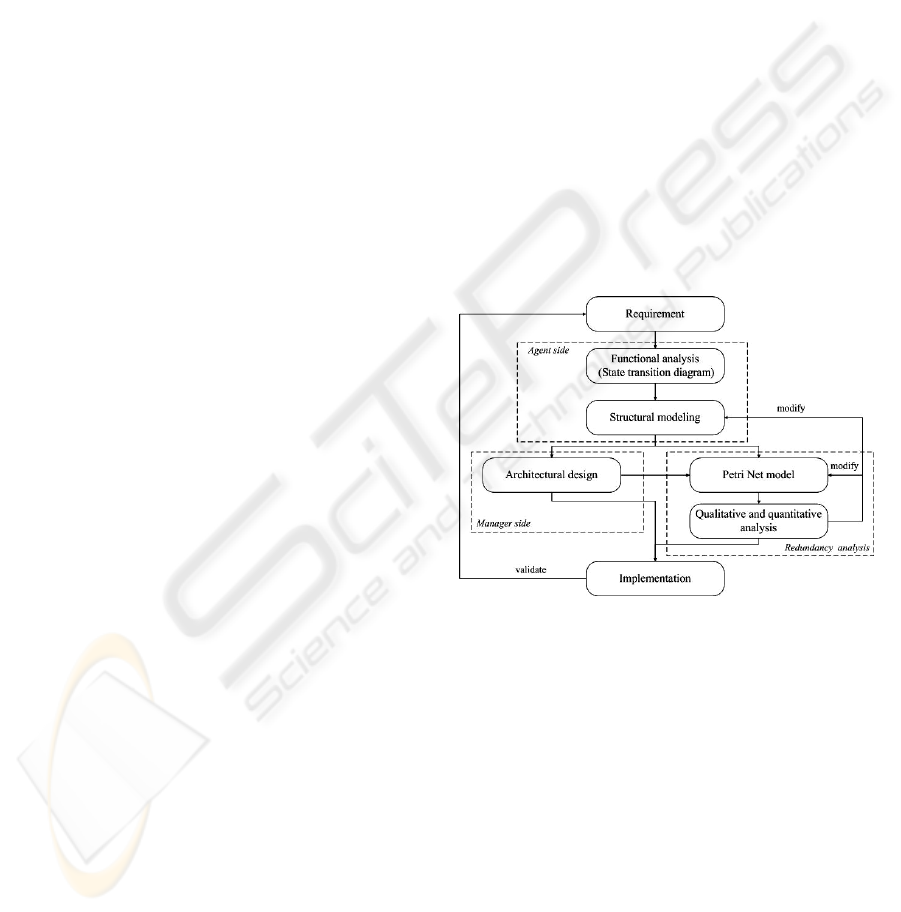
Our approach develops high assurance systems
with PN model and analysis. As is shown in Fig. 1,
at the stage of functional analysis, state transition
diagrams are used to depict the requirements
corresponding to the purposed system. Then a model
of detailed structure is set up to describe
relationships of the agent side at the stage of
structural modeling. Subsequently, at the
architectural design stage, the approach is completed
by finishing the design of the manager side. By
constructing PN models, we can perform both
qualitative and quantitative redundancy analysis
when designing the agent side and manager side.
Finally, the obtained schema is implemented and
validated. If it does not meet the requirements, the
procedure will return to the beginning. Thus the
system is developed in an iterative and incremental
way.
Fi
g
ure 1: The develo
p
ment
p
rocedure for s
y
stem.
ICINCO 2005 - SIGNAL PROCESSING, SYSTEMS MODELING AND CONTROL
38
4 REDUNDANCY MODELING
AND ANALYSIS
In this section, our redundancy architecture of the
remote monitoring and control system is introduced
first. Then, a formalism to build PN is constructed to
represent the working process of sensors, motors,
and other components of agent side. PN model about
software redundancy is also derived from the
manager side. At last, analysis of redundancy is
discussed.
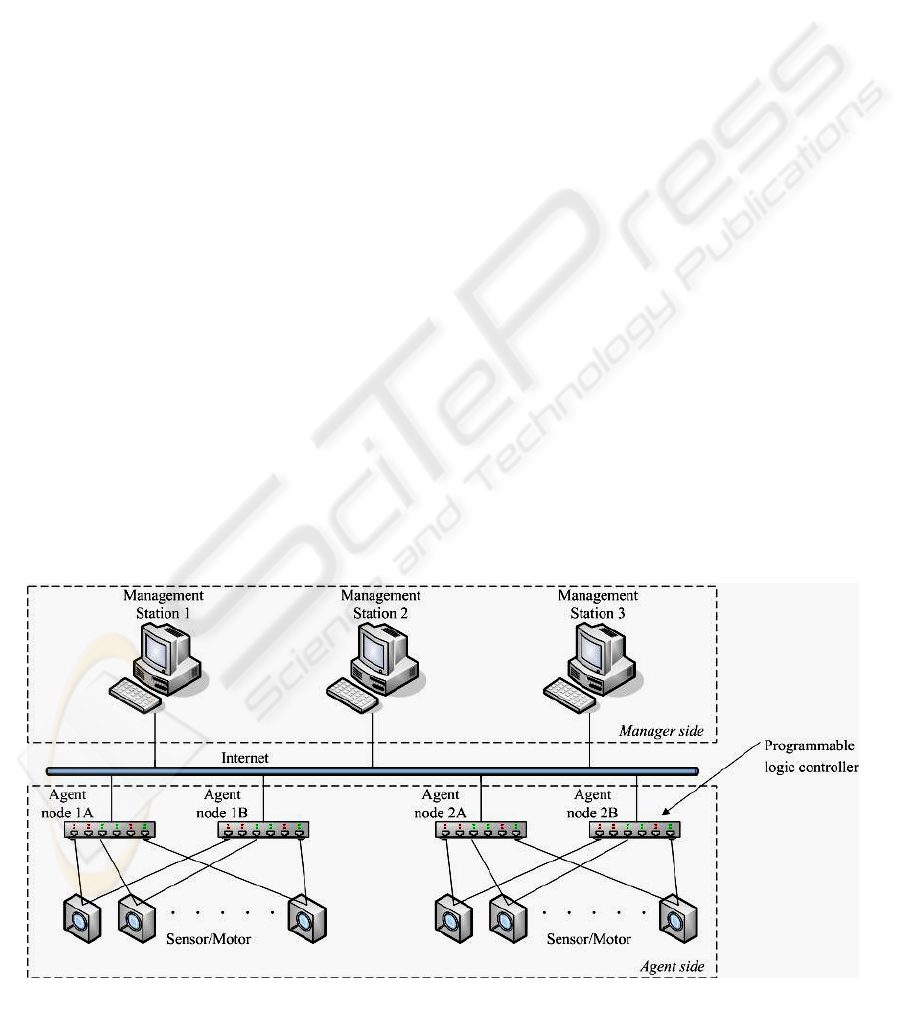
4.1 Redundancy architecture
Remote monitoring and control system with
redundancy architecture can run properly even when
some parts have faults. The redundancy architecture
presented in our work which implements both
hardware and software redundancy is shown in Fig.
2.
In the agent side, each sensor and motor connects
with two agent nodes with completely the same type.
Application program works in parallel, and realizing
the data sampling and communication tasks. The
comparison algorithm is used by management
stations to automatically find the abnormal agent
node. When the two agent nodes run normally, they
send the same sampling data to network from the
same sensor. Once one of them is wrong, the
comparison program would find it by comparing
data and diagnosing status information. Then the
management station would dynamically remove the
abnormal node, and inform the system manager.
Software redundancy is more complex and harder
to implement compared with hardware backup of
parallel-style. But it needs less resource. Since the
management station is power enough to run
advanced software, software redundancy technology
is a good choice in the manager side. In software
redundancy architecture, tasks are performed by
service processes dynamically generated by fault
toleration program. The states of stations and the
fault toleration program will decide which station
would perform the task. If a task fails, the software
redundancy mechanism will invoke error recovery
method to avoid single task failure. If a station fails,
the fault toleration software will automatically
assign another station to take over the faulted node
and announce fault alarm immediately. The UPS
should be used as power supply of management
stations in real application.
4.2 Modeling of redundancy
structure
To outline our work in a formal way, we introduce
the following definitions of state transition diagram
and Petri net.
Definition 1: A state transition diagram is a 4-tuple
},,,{
0
qEQSTD
δ
=
, where
1.
},,,{
21 m
qqqQ
=
denotes a finite set of
states,
2.
},,,{
21 n
eeeE
=
denotes a finite set of
transitions,
3.
δ
denotes the state transition function defined on
EQ
×
, and ,qQe∀∈ ∃∈
:(,) (,)
E
qQ qe q qe q
δ
δ
′
′′
∧
∈=∨=
,
4.
Qq
∈
0
is called the initial state.
Definition 2: A Petri net is a 4-tuple
},,,{
0
MFTPPN
=
, where
1.
},,,{
21 m
pppP
=
denotes a finite set of
Fi
g
ure 2: Redundanc
y
architecture.
MODELING AND ANALYSIS OF REDUNDANCY IN REMOTE MONITORING AND CONTROL SYSTEMS VIA
PETRI NETS
39

places,
2.
denotes a finite set of
transitions,
},,,{
21 n
tttT =
3.
φ
=TP ∩
and
φ
≠TP ∪
,
4.
F
is the incidence function defined on
, and denotes the set of arc links
between places and transitions,
)()( TPPT ×× ∪
5.
0),(0),(:,
≠
∨≠∈∃∈∀ ptFtpFTtPp
,
0),(0),(:, ≠∨
≠
∈∃∈∀ ptFtpFPpTt
6
0
is the set of token values defined on P and
is called the initial marking.
M
4.2.1 PN model of sensors and motors
The sensors and motors often have straightforward
state transition diagrams since they are designed in a
high reliable way with only a few states. The PN
model derived from state transition diagram is
formally specified as follows.
Definition 3: If
},,,{
0
qEQSTD
δ
= is a state
transition diagram, the Petri net of it,
,
is defined to be
where
)(STDPN
},,,{)(
0
MFTPSTDPN =
1. Places and transitions:
, and
QP =
E
T
= ,
2.
if 1),( =tpF ),( tp
δ
is defined and
if 1),( =ptF ),( pt
δ
is defined,
3. Initial mapping:
if npM =)(
0 0
qp
=
, 0
otherwise.
4.2.2 Agent side PN model
Agent nodes are more sophisticated than sensors or
motors due to their processing and control
interaction between sensor/motors and management
stations. They are the most crucial devices having
connecting links between the preceding and the
following in remote monitoring and control systems.
We introduce the following definition to formalize
the agent side PN model.
Definition 4: A state transition diagram
},,,{
0
qEQS
δ
= is a state transition diagram of
agent node, if
cmio
QQQQ ∪∪
=
and
, where
cmio
EEEE ∪∪=
φ
=
=
=
ciocmmio
QQQQQQ ∩∩∩ and
φ
=
=
=
ciocmmio
EEEEEE ∩∩∩ , satisfy
the following conditions:
1.
,
0 io
Qq ∈
},,,{
21 cjccc
qqqQ =
},,,{
21 mjmmm
qqqQ =
,
baio
EEE ∪=
,
aoaia
EEE ∪= ,
bobib
EEE ∪=
,
biaii
EEE ∪= ,
boaoo
EEE ∪=
,
φ
===
bobiaoaioi
EEEEEE ∩∩∩ and
.
},,,,{
21 ainaiaiai
eeeE =
},,,,{
21 aonaoaoao
eeeE =
},,,,{
21 bikbibibi
eeeE =
},,,{
21 bokbobobo
eeeE =
2. For any
, if
c
Ee ∈
),( eq
δ
is defined, then
cio
QQeq ∪∈),(
δ
; for any , if
io
Ee ∈ ),( eq
δ
is defined, then
mio
QQeq ∪∈),(
δ
if
mio
QQq ∪
∈
or
cio
QQeq ∪∈),(
δ
if
cio
QQq ∪
∈
; and for any
m
, if Ee ∈ ),( eq
δ
is
defined, then
mio
QQeq ∪
∈
),(
δ
.
Remark 1: In an agent node state transition
diagram ,
m
represents the set of possible
monitor states when the agent node plays the role as
a monitor of sensors and motors,
c
Q represents the
set of possible control states when the agent node
plays the role as a control of sensors and motors,
io
represents the set of possible I/O states when
the agent node does some communications.
S Q
Q
Remark 2: Similarly,
m
E represents the set of
possible monitor transitions when the agent node
plays the role as a monitor,
represents the set of
possible control transitions,
represents the set
of possible I/O transitions.
a
E represents the I/O
transitions which communicate with sensors and
motors and
b
E represents the I/O transitions which
communicate with management stations.
i
E
represents the I/O transitions which receive a
massage and
o
E represents the I/O transitions
which send a massage.
ai
E ,
ao
,
bi
, and
bo
E
have the same interpretation with respect to the I/O
transitions.
c
E
io
E
E E
Remark 3: Condition (1) implies that for each
monitor state, there is a corresponding control state;
and for each transition which send messages to
sensors and stations, there is a corresponding
transition which receives messages from sensors and
stations respectively and vice versa.
Remark 4: Condition (2) indicates that the
monitor transitions will always keep the agent node
in the monitor state; and that the control transition
will always keep the agent node in the control state.
To guarantee that a sequence of messages sent can
always be processed, and a sequence of control
actions will always correspond to some monitor
behaviors, we introduce the monitor compatible
condition. To do this, the following notations are
introduced: for any state
, its co-state is
defined as
Qq ∈
qq
=
if
io
Qq
∈
, or
ckmk
qqq /= if
mkck
qqq /
=
; for any transition , its co-
transition is
Ee ∈
ckmk
eee /
=
if , or
mkck
eee /=
aokaik
eee /
=
if
aik
, or
aok
eee /=
bokbik
eee /
=
if
bikbok
eee /
=
; for any sequence
of transitions , its co-sequence of
transitions is
*
1
Eeex
s
∈= …
s
eex …
1
=
. Then an agent node is
said to be monitor compatible if and only if
**
()( ),
cio mio
:
x
EE E E pQ∀∈ ∈∪∪∪
(,) (,)qpxqpx
δ
δ
=
⇔= .
Since the agent side is composed of agent nodes,
sensors and motors, and two agent nodes with lots of
sensors as well as motors are the elementary
components, we introduce the following definition
to derive the PN model in terms of
and .
S STD
ICINCO 2005 - SIGNAL PROCESSING, SYSTEMS MODELING AND CONTROL
40
Definition 5: If
1
S
and
2
are two state transition
diagrams of a pare agent nodes,
r
are
S
STDSTD ,,
1
r
state transition diagrams of sensors and
motors, the elementary agent side PN,
is defined to be
where
),
1
;,( STDSTDSSPN
),,,(),;,(
0121
MFTPSTDSTDSSPN
r
=
21 r
1.
, ,
121 1ss r
PQ Q Q Q C= ∪∪∪∪∪∪
r
C∪ },,,,,{
11
j
on
j
o
j
in
j
ij
ppppC =
rss
EEEET ∪∪∪∪
121
=
2.
if 1),( =tpF ),( tp
k
δ
is defined or
, or ;
),(),(
l
aiu
j
iu
eptp = ),(
j
w
j
ou
ep
1),(
=
ptF
if
),( pt
k
δ
is defined or , or
; otherwise, , where
; ; ;
; .
),(),(
j
ou
l
aou
pept =
),(
j
iu
j
w
pe
0),( =ptF
rj ,,1 = rssk ,,1,2,1 = 2,1 ssl =
nu ,,1 =
||,,1
j
Ew =
3.
if , 0 otherwise.
k
npM =)(
0
k
qp
0
=
),;,(
121 r
STDSTDSSPN
is constructed by
connecting
1
, and
r
through
additional places
r
. These new places
represent the communication point between the two
parts. Message exchange between the two parts can
be achieved only through the communication point.
The PN model will specify all the possible monitor
and control actions between an agent node and
sensors by using the execution rule of PN. Thus, the
PN model of agent side has been derived.
S
2
S STDSTD ,,
1
CC ,,
1
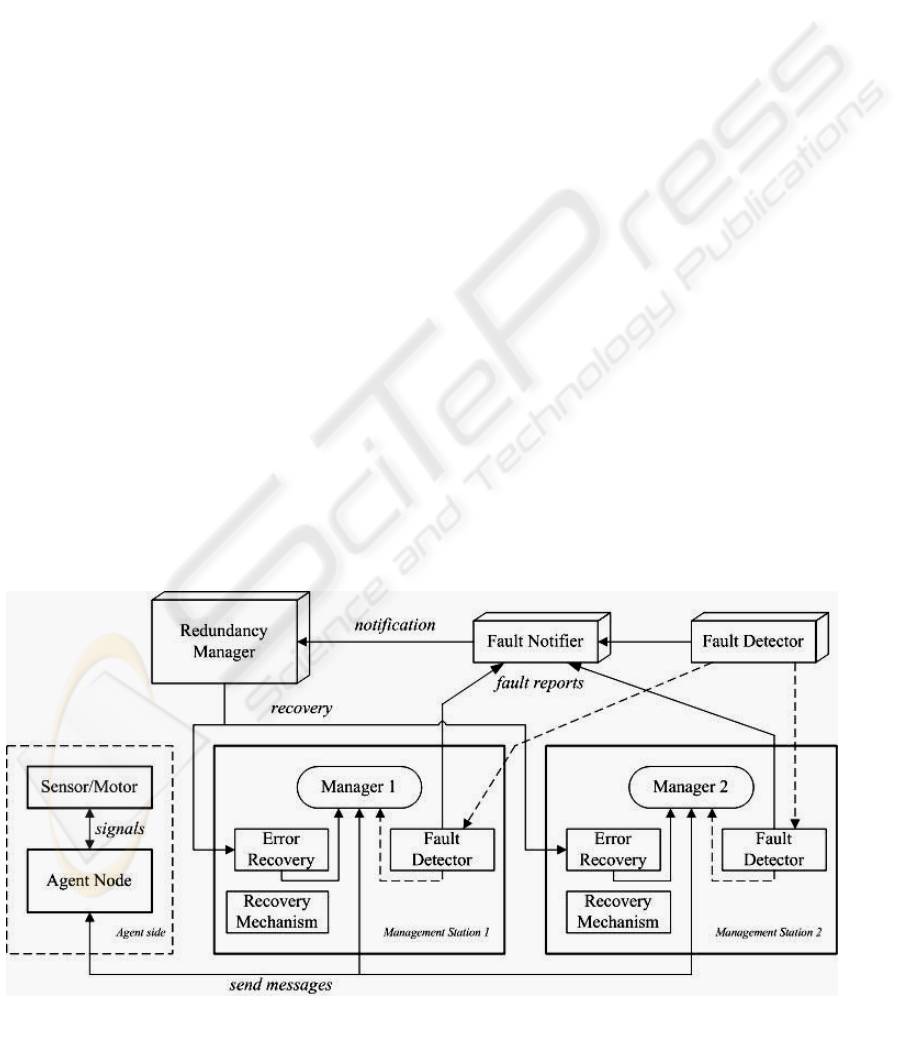
4.2.3 PN model of software redundancy and
the system
Fault tolerant software architecture is widely used to
form a redundancy structure in distributed systems.
Several approaches have been proposed to build
highly available applications. As shown in Fig. 3,
fault tolerance is provided by the replication of
managers, fault detection and error recovery. The
agent side should not be aware of the faults in the
management station or the recovery from faults, nor
should it be aware of the fact that the managers are
replicated. Local fault detectors are monitored by a
global fault detector which detects when a local fault
detector is not available. Managers are continuously
monitored by local fault detectors which are
deployed on each management station. If a fault
occurs, then the local fault detector reports the error
to the fault notifier. The fault notifier analyzes
incoming error reports and sends a notification to the
redundancy manager. When the redundancy
manager receives a notification, it would initiate the
recovery of the manager or assign another manager
to handle it.
We are interested in redundancy model in the early
phases of system design, so that decisions can be
made to choose the best redundancy scheme.
Therefore, we focus on the abstract from
implementation details. In our approach, we first
give a UML model about software redundancy
architecture and then a PN model. The most
sophisticated part in the redundancy structure is the
model of redundancy manager, which should
consider the event queue, dispatcher and
dependency.
The model proposed here is an object model
which can be easily specified by unified modeling
language (UML). Lots of approaches have been
proposed to derive PN model from UML model
automatically, therefore it is easy to get the PN
model of the manager side.
Combining the PN model of agent side and the
PN model of manager side is similar to combining
the PN model of agent node and the PN model of
sensors and motors. Here is the definition.
Definition 6:
0
(,, , )
aa a a
PNA P T F M
=
Figure 3: Management side redundancy structure.
MODELING AND ANALYSIS OF REDUNDANCY IN REMOTE MONITORING AND CONTROL SYSTEMS VIA
PETRI NETS
41
11 1 1
12 1 1
(,; , )
r
PN S S STD STD∪
12 1
(,; , )
s
ss s
rs
PNSSSTD STD∪
is the agent side
PN and
is the
manager side PN.
is the possible set of
transitions when manager side communicates with
agent side. Then the system PN
is defined to be
where
),,,(
0
mmmm
MFTPPNM
TT
c
⊂
),( PNAPNMPN
),,,(),(
0
MFTPPNAPNMPN =
1.
,
,
s
ma
DDPPP ∪∪∪∪
1
=
},,,,,{
11
j
ok
j
o
j
ik
j
ij
ppppD =
am
TTT ∪=
2.
if or ,
or
, or ;
if or ,
or
, or ; otherwise,
, where
1),( =tpF 1),( =tpF
a
1),( =tpF
m
),(),(
jl
biu
j
iu
eptp = ),(
w
j
ou
tp
1),( =ptF 1),( =ptF
a
1),( =ptF
m
),(),(
j
ou
jl
bou
pept = ),(
j
iuw
pt
0),( =ptF sj ,,1
=
; ;
; .
2,1 ssl =
ku ,,1 = ||,,1
c
Tw =
3.
, 0
otherwise.
)()()()(
0000
pMpMpMpM
ma
=∧=
4.3 Analysis of redundancy
PN model analysis can be both qualitative and
quantitative. Qualitative analysis shows the
structural characteristics and qualitative analysis
shows performance. Both qualitative and
quantitative analysis can be performed in our PN
model.
In our qualitative analysis, we consider the liveness
and boundedness properties. The liveness property
means that the system can be executed properly
without deadlocks, and boundedness property means
that the system can be executed with limited
facilities. For quantitative analysis, appropriate
parameters, such as time period or error probability,
are assigned for the PN model.
Simulations will show us the critical transitions of
the system. Moreover, the sensitivity analysis based
on static cycle methods can also find the critical
timed transitions.
5 AN EXAMPLE
Our illustrative example is a model of an application
about oil well. In this example, there are 3 wells.
Each well, 20 temperature sensors, 20 humidity
sensors, 4 power sensors, 4 current sensors, 4
voltage sensors, and 120 binary sensors are
connected to a pair of agent nodes to be monitored.
As faults occur, corresponding control actions such
as power off the motors and reset the sensors are
taken. Moreover, there are three management
stations for safety in case of managers’ crash. In the
following presentation we focus on the model of
agent nodes and software redundancy.
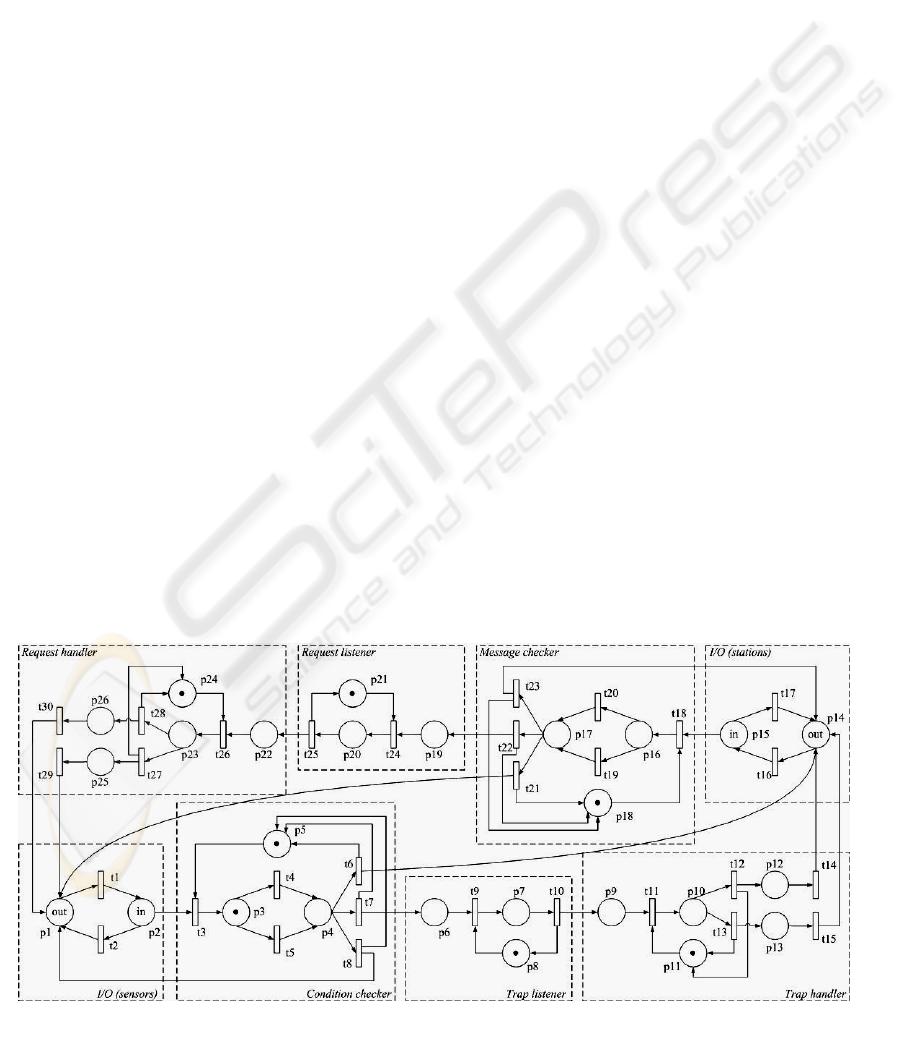
5.1 PN mode
Based on the state transition diagram, information
can be extracted to build a PN model. The model of
temperature and voltage sensors have 3 places and 4
transitions each, while the model of power and
binary sensors have 2 places and 2 transitions each.
The simplified PN of agent node is shown in Figure
4. It consists of 26 places and 30 transitions. This
PN model satisfies Definition 4 and monitor
compatible condition. That is to say all messages
sent will be processed, and all control actions will
correspond to monitor behaviours.
Without restricting the interfaces and the
implementation of the system, we assume that 4
events, unrecoverable, recovered, task fault, station
fault are processed by redundancy manager. Figure 5
depicts the PN model of the manager side with 3
stations and a 4 length buffer. t6 causes task fault,
while t7 recovers task fault, and t8, t9 cause station
Fi
g
ure 4: PN model of a
g
ent node.
ICINCO 2005 - SIGNAL PROCESSING, SYSTEMS MODELING AND CONTROL
42
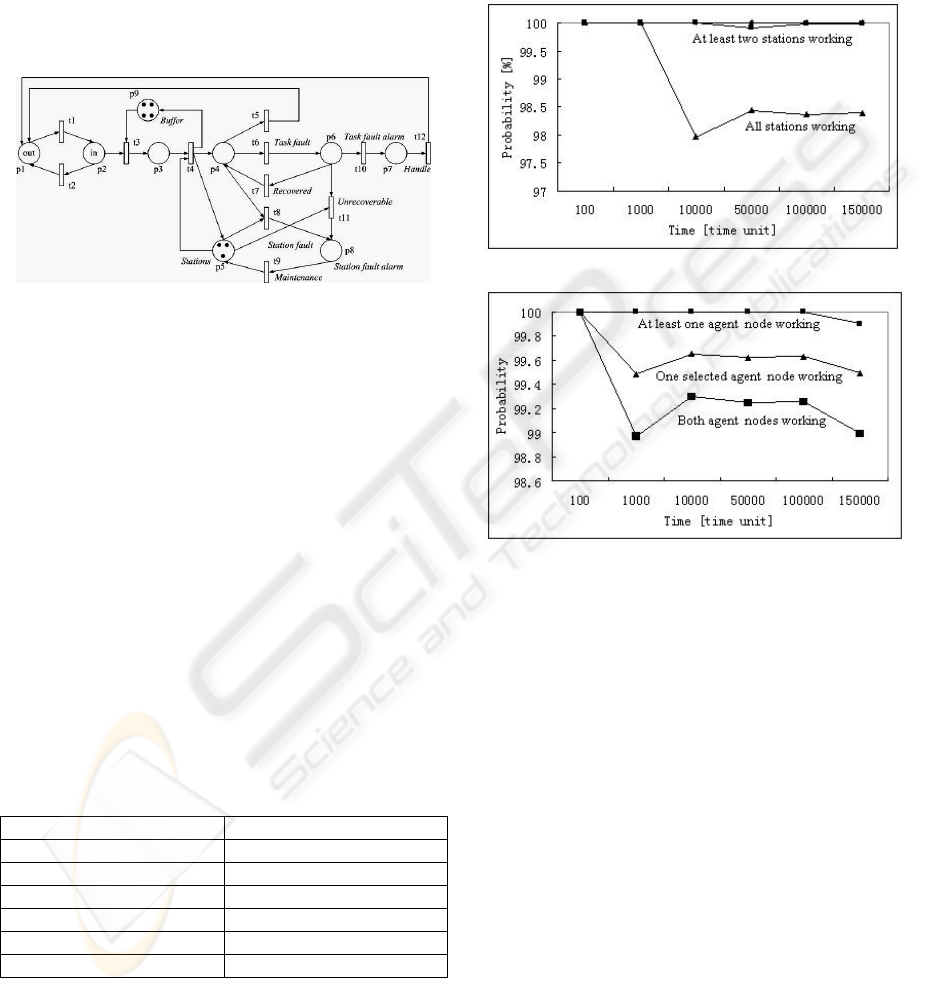
fault. If there are no tokens in p5, t4 will never be
triggered. It means that if there are no stations
available, manager side will refuse to receive any
tasks. The failure of a station is effectual only if a
task is deployed on it. t9 and t12 are triggered by
administrators which means that both task fault
alarm and station fault alarm will cause the
administrators to reset the systems. Obviously, these
operations will take a long time and degrade the
reliability level.
By using definition 5 and 6, the PN model of
redundancy about the whole remote monitoring and
control system can be derived now. The software
package STPNPlay is adopted to verify quantitative
properties of the PN model because of its graphical
representation, ease of manipulation, and ability to
perform performance analysis.
5.2 Measurement results
The PN model of the system consists of more than
200 places and 200 transitions. The analysis answers
two questions. One is what is the probability of
having at least one working station and the other is
what is the probability of having at least one
working agent node. In the early phase of the design
usually timed PN transitions with exponential
distribution are used in the model and the designer
estimates the parameters of the distributions. This
assumption enables an analytical solution of the
model. Here we assumed the following parameters:
Modeled occurrence Average time units
Station failure 10,000
Task failure 1,000
Task recovery 10
Local fault detection 10
Global fault detection 100
Agent node failure 10,000
The simulation on STPNPlsy has reached
following results. As Fig. 6 shows, the probability of
having at least one working station is bigger than
99.99%, of having at least two working stations is
99.9% and of having three working stations is
98.4%. Similarly as Fig. 7 shows, the probability of
having at least one working agent node is 99.9%, of
having a selected working agent node is 99.6% and
of having both working agent node is 99.1%.
In early design phase, a critical question is the
comparison of different architectural solutions.
Designers can reduce the design cycle by comparing
different solutions and dwelling on the best fitting
one. In our example, the parameter of the number of
stations and agent nodes can be used to achieve the
required availability. The comparison of systems
with different number of stations and agent nodes is
quite easy and the required modification of the PN
model is straightforward.
Fi
g
ure 6: Probabilit
y
of havin
g
workin
g
stations
Fi
g
ure 5: PN model of mana
g
ement side.
Fi
g
ure 7: Probabilit
y
of havin
g
workin
g
a
g
ent .
5.3 Further work
The results of this study lead to the following
discussion. Since the manager side model developed
here for application to remote monitoring and
control system is based on the object-oriented
concept, reusable models can be grouped into a
library to make the design process more efficient.
Exponential timing is not the most appropriate
assumption of fault handling policy. The analysis
can be performed correctly by using SRN models
with deterministic timed transitions. Security is a
prime concern for many network control systems.
Improving the security by applying security protocol
MODELING AND ANALYSIS OF REDUNDANCY IN REMOTE MONITORING AND CONTROL SYSTEMS VIA
PETRI NETS
43

should be feasible. Formalism method is becoming
popular in developing systems. With its illation and
math form, it can guarantee the systems properties in
a mathematical way. Thus a powerful and easy
usable formalism method would be a great benefit.
6 CONCLUSION
This paper presents a Petri net based approach to
achieve design and modeling of redundancy in
remote monitoring and control systems. The
complex redundancy architecture can be analyzed
automatically. The analysis can be performed in
early design phase when the system structure and
redundancy behaviour is defined. The manager side
model is object-oriented, which describes software
redundancy architecture. While the agent side model
is more detailed, describing hardware redundancy
architecture. The state transition diagram is
transformed to a PN model which is analyzed by off-
the-shelf tools. The optimal redundancy architecture
can be selected by modeling different redundancy
architectures, considering monitor compatible
condition and subsequent property analysis.
REFERENCES
M. Kunes and T. Sauter, “Fieldbus-Internet connectivity:
The SNMP approach,” IEEE Trans. Ind. Electron.,
vol. 48, pp. 1248–1256, Oct. 2001.
R. L. Kress,W. R. Hamel, P. Murray, and K. Bills,
“Control strategies for teleoperated Internet
assembly,” IEEE/ASME Trans. Mechatron., vol. 6,
no. 4, pp. 410–416, 2001. Focused section on
Internet-based manufacturing systems.
C.A. Petri, “Fundamentals of a theory of asynchronous
information flow”, In Proc. of the IFIP Congress 62,
pp. 386-390, 1963.
D. Harel, "Statecharts: A Visual Formalism for Complex
Systems," Science of Computer Programming Vol. 8
(1987), pp. 231-274.
W. M. Zuberek, “Timed Petri nets in modeling and
analysis of cluster tools,” IEEE Trans. Robot.
Automat., vol. 17, pp. 562–575, Oct. 2001.
R. David and H. Alla, “Petri nets for modeling of
dynamics systems-A survey,” Automatica, vol. 30,
no. 2, pp. 175–202, 1994.
M. K. Molley, “Performance analysis using stochastic
Petri nets”, IEEE Trans. Comput., vol. C-31, pp. 417-
423, 1985.
L. E. Holloway, B. H. Krogh, and A. Giua, “A survey of
Petri net methods for controlled discrete event
systems,” Discrete Event Dyna. Syst., vol. 7, no. 2,
pp. 151–190, Apr. 1997.
R. Zurawski and M. C. Zhou, “Petri nets and industrial
applications: A tutorial,” IEEE Trans. Ind. Electron.,
vol. 41, no. 6, pp. 567–583, 1994. Special Section—
Petri Nets Manufact..
A. Weaver, J. Luo, and X. Zhang, “Monitoring and control
using the Internet and Java,” in Proc. IEEE Int. Conf.
Industrial Electronics, San Jose, CA, 1999, pp. 1152–
1158.
S. Maffeis and D. C. Schmidt. Constructing reliable
distributed communication systems with CORBA.
IEEE Communications Magazine, 14(2), 1997.
John Anil Saldhana, Sol M. Shatz, and Zhaoxia Hu,
“Formalization of Object Behavior and Interactions
From UML Models”
R. S. Srinivasan, “Modeling and performance analysis of
cluster tools using Petri nets,” IEEE Trans.
Semiconduct. Manuf., vol. 11, no. 3, pp. 394–403,
1998. Special Section—Petri Nets Semiconduct.
Manufact.
.
ICINCO 2005 - SIGNAL PROCESSING, SYSTEMS MODELING AND CONTROL
44
