
A NOVEL ENTROPY METHOD FOR CLASSIFICATION OF
BIOSIGNALS
Andrea Casanova, Valentina Savona and Sergio Vitulano
Dipartimento di Scienze Mediche Internistiche
Università di Cagliari, via San Giorgio 12, 09124 Cagliari, Italy
Keywords: Entropy, signals.
Abstract: The paper introduces entropy as a measure for 1D signals. We propose as entropy measure the relationship
between the crest of the signal (i.e. its portion contained between the absolute minimum and maximum) and
the energy of the signal. A linear transformation of 2D signals into 1D signals is also illustrated. The
experimental results are compared to several fuzzy entropy measures and other well-known methods in
literature. Experiments have been carried out on medical images from a large mammograms database; this
choice is due to the high-degree of difficulty of this kind of images and the strong interest in the scientific
community on medical images. The capability of the methods was tested in order to discriminate between
benignant and malignant microcalcifications.
1 INTRODUCTION
The concept of entropy has been developed in
thermodynamics in order to characterize the ability
of a system in changing his status. Measures of
system entropy are usually functions defined in the
phase space and they reach the maximum or
minimum value, depending on the contextual
definition, whenever system variables are uniformly
distributed.
This concept has been borrowed in
communication systems for coding purposes and
data compression . Entropy based functionals have
been also used in image and signal analysis to
perform deconvolution and segmentation , to
measure the pictorial information and to define
image differences .
Several entropy measures, defined on the feature
space, have been introduced. The measure of the
entropy in image classification is not a new one ;
the idea of cross entropy has been used to define the
distance which is popularly known as Kullback-
Leibler information distance.
However, this distance between two distributions
should not be considered as the true distance,
because it is not symmetric and does not satisfy the
triangle inequality. It may be mentioned that in early
sixties connections among statistics, quantum
mechanics and information theory have been
thoroughly studied by several authors , using
Shannon maximum entropy principle. Caianiello
proposed that such a connection can be obtained in
the natural meeting ground of geometry. In the
following we present two classes of entropic
measures: the fuzzy entropy and the Vitulano’s
entropy .
The choice to use mammograms is due to the
development of new imaging methods for medical
diagnosis that has significantly widened the scope of
the images available to physicians.
The problem is to realize a mapping from the set
of all possible images (image space) to the set –
usually smaller – of all possible features value
(feature space).
2 RELATED WORKS
Solutions proposed in literature follow different
approaches and emphasize different aspects of the
problem. In several CAD methods applied to
mammography feature enhancement is carried out
by evaluating the results due to wavelet transforms.
The general approach consists of multiple steps:
• computation of the forward wavelet transform
of the image;
• nonlinear transformation or adaptively
276
Casanova A., Savona V. and Vitulano S. (2005).
A NOVEL ENTROPY METHOD FOR CLASSIFICATION OF BIOSIGNALS.
In Proceedings of the Second International Conference on Informatics in Control, Automation and Robotics - Signal Processing, Systems Modeling and
Control, pages 276-281
DOI: 10.5220/0001174102760281
Copyright
c
SciTePress

weighting of the wavelet coefficients;
• computation of the inverse transform.
A number of techniques have appeared in
literature; differences among these approaches are
related to the types of decomposition and
reconstruction parameters taken into account.
Our contribution to the analysis and CAD
methods is to introduce an entropy measure of the
signal in order to cluster microcalcifications in
mammograms.
3 METHODS
As previously stated, two different entropy measures
are introduced and their properties outlined: fuzzy
and Vitulano’s method.
Fuzzy entropy method may be summarized as
follows:
• computation of the fuzzy-entropy; fuzzy
entropy is function of the distribution of the
pixel grey levels. The entropy measures
characterize the difference of the minimum
intensity values distribution with respect to the
mean intensity;
• application of a Bayesian classifier in the new
feature space.
The Vitulano’s entropy method requires almost three
different steps:
• selection of nine disjoint Regions of Interest in a
mammogram;
• transformation of the related 2D signal into a
1D signal;
• computation of the entropy features
3.1 Fuzzy entropies
In this study four different types of fuzzy entropies
are introduced. The term “fuzzy” is due to their
characteristic to satisfy some of the formal
properties of the classical entropy (introduced by
Shannon); even if they are computed on image
features that are not probabilities.
The input image,
(
)
n
ff ,,
1
…≡f
, is represented as
a linear signal after the transformation from raster to
spiral indexing.
Moreover, we define the vector
()
n
hh ,,
1
…≡h , where
⎪
⎩
⎪
⎨
⎧
>−
=
otherwise
i
fm
i
fm
i
h
0
and
(
)
niformeanm …,1
=
=
f
that represents all values that are below the mean
value, m.
Starting from these definitions we define the
following measure of fuzzy entropies:
()
() ()
()
ηηηη
−×−−×−×= 1log1log
2log
1
0
G (1)
⎟
⎠
⎞
⎜
⎝
⎛
−
×−
−
××
−
=
11
1
2
1
η
η
η
η
ee
e
e
G
(2)
(
)
η
η
−
×
×
=
14
2
G (3)
∑
=
×−=
n
i
i
h
i
h
n
G
1
log
log
1
3
(4)
with
∑
=
=
n
i
i
h
n
1
1
η
or
∑
=
=
n
i
i
h
n
1
2
1
η
.
It is noteworthy that η gives a measure of the
distance between the constant function f=m and the
function
h . Moreover, all these measures of entropy
are convex and their values range in the interval
[0,1]. The maximum of G
i
(for i=0, 1 2) is equal to 1
and is reached for η=0,5 while the maximum of
3
G
is reached for h
i
=n
-1
and it is also equal to 1. Further
details concerning fuzzy entropies here introduced
can be found in Caianiello (see References).
3.2 The Vitulano’s method
There are different methods meant to read the
information contained in a digital image: in rows, in
columns, or by recurring to specific paths. The
choice of the scansion method is connected to the
type of information that somebody wants to pick out
from the image (e.g. a certain recurrence in a
direction, the search of the points of maximum or
minimum of the surface image in order to carry out
the histogram, the time of the calculus etc).
Mapping a signal from 2D into 1D space is also
one of the main step of our method; the use of the
spiral method allowed us to perform the expected
target (connected pixels, set of pixels that locate the
regions of the image etc.).
We define: A
m,n
as the domain of the surface
image where (m, n) are respectively the number of
rows and columns of A.
Only out of simplicity of expression, we place
m=n, i.e. A is a square matrix.
A NOVEL ENTROPY METHOD FOR CLASSIFICATION OF BIOSIGNALS
277

S
-1
Definition 1
We define crown of the matrix C
1
the set of the
pixels
C
1
={a
1,1
…a
1,n
; a
2,n
…a
m,n
; a
m,n-1
...a
m,1
; a
m-1,1
…a
2,1
} (5)
that is, the order set of pixels contained in the row
m=1
of the matrix, in the n-th column, in the m-th
row, in the first column except the pixel, a
1,1
since it
is already contained in the first row.
Let P is a discrete mono dimensional signal, so
that:
P(x) = Px
1
, Px
2
,….., Px
i
,…Px
k
Definition 2
Therefore, we define first differential
∆
1
Px
i
= Px
(i+1)
- Px
i
(6)
Definition 3
We define second differential:
∆
2
Px
i
=∆
1
Px
i
- ∆
1
Px
(i-1)
(7)
If we substitute the values ∆
1
Px
i
-∆
1
Px
(i-1)
∆
2
Px
i
= ∆
1
Px
i
-∆
1
Px
(i-1)
= Px
(i+1)
- Px
i
- (Px
i
- Px
(i-1)
)=
= Px
(i+1)
- 2Px
i
+ Px
(i-1)
It is easy to verify that for every pixel belonging
to a crown of the matrix, the second differential
assumes value 0.
It is straightforward that considering three pixels,
belonging to a crown, the relation (7) assumes value
0, and they are 4-connected with respect to the
central pixel.
If we suppose A
m,n
a bidimensional signal and
C
1
,……, C
k
the crowns contained in its domain, we
define joined spiral to the signal Am,n the relation:
i
C
ki
UT
,1=
=
(8)
where C
i
is the i-th crown obtained from the matrix
A
m,n.
It is important to observe that the relation (8)
realizes a linear reversible transformation of a
generic signal in a space 2-D in a signal in a space 1-
D.
Therefore it follows:
A
m,n
T
mxn
(9)
Due to (9) a one to one application is established
between each of the elements tk belonging to T with
each of the pixel a
i,j
of the matrix A
m,n
.
The transformation S maintains the information
regarding the form and the dimensions of the image
domain, the topological information such as the
number of the objects and their position, the area
and the outline of the objects, etc.
For example, we assume t
k
as the element to
which corresponds the pixel a
i,j
, so the pixels 4-
connected to a
i,j
, correspond to the elements in T for
which the condition (10) is satisfied
∆
2
t
n
= 0 or ∆
2
t
n
= 8 (10)
The pixels of a object in A are 4-connected, so :
The area of the object is given by the set V,
whose elements satisfy the relation (10);
the contour of the object is given by the subset
VV ∈
1
whose elements contain almost a ground pixel
among its 8-connected pixels;
From the elements belonging to the set V
1
we are
able to extract the following information:
•
topological information – from the abscissa
of a point belonging to T, we obtain the
indexes of rows and columns of the pixels
related to A;
•
the shape of the object – from the elements
related to
VV ∈
1
, we are able to describe the
shape of the object contained in A;
•
shape 3-D of the object – for each of the
elements related to V, we compute: its
location in the domain of A (index of row
and column) and its grey level. So it is
possible to have both the information over
the 3-D shape and to reconstruct V pixel by
pixel.
In a previous work , we have proposed the HER
(Hierarchical Entropy based Representation)
method, as the algorithm meant to realize the
information retrieval from a multidimensional
database.
Briefly the relevant point about HER that a 1-D
signal, T, may be represented by a string F, such:
that:
T≈ F= m
1
e
1
; m
2
e
2 ;
…….. ; m
k
e
k
(11)
where {m}= m
1,…..,
m
k
are the maxima extract in a
hierarchical way from T;
and {e}= e
1,…..,
e
k
are the energies associated to the
maxima
{
}
mm
i
∈
Let’s suppose a 1-D signal T, where m and M
corresponding to the absolute minimum and
maximum of T and ET its total energy .
It is important to underline that
m
and M
aren’t either the smaller or the bigger of the ordinate
of the points of T, but the minimum and the
maximum of the signal T (in a mathematical sense).
We define signal crest, C, the portion of the
signal T between
m and M.
S
ICINCO 2005 - SIGNAL PROCESSING, SYSTEMS MODELING AND CONTROL
278
In other words, the signal crest is obtained by
placing the zero of the axes of ordinates equal to
m .
We assume Ec the energy of the crest signal C.
We apply to the signal C the method HER ,
obtaining {m
k
} and {e
k
} as the maxima and the
energies of C respectively.
Let
{
}
k
e
i
e ∈
the energy associated to the
maximum
{
}
k
m
i
m ∈
Definition 4
We define entropy of the signal T the relation:
T
K
i
i
T
E
e
S
∑
=
=
1
(12)
It is straightforward that both the entropy of a
constant signal (constant value of the function) and
of a monotone signal (constant derivative) is equal
to zero.
On the other hand the entropy equal to 1
corresponds to the maximum degree of disorder, i.e.
there are not two points (x
i
, x
i+1
) in the signal
domain that have the same ordinate.
4 EXPERIMENTAL RESULTS
An application on breast cancer mammograms was
carried out in order to compare the behaviour of the
different entropy measures above introduced.
4.1 Experiment with fuzzy entropies
Table 1 shows the mean values, µ, and the standard
deviation, σ, of the distributions of G
0
, G
1
, G
2
, G
3
and for the two classes of malignant (MM) and
benignant (MB) microcalcification.
The result indicates that in the average the
entropy of classes MM is greater than the entropy of
class MB. The four measures have been used as a
new features space, allowing a better discrimination
among these classes of diseases.
Table 1
µ
MM
σ
MM
µ
MB
σ
MB
G
0
3.25 0.79 1.48 0.78
G
1
12.47 0.91 9.20 3.00
G
2
2.00 0.55 0.94 0.45
G
3
15.00 1.10 11.70 1.70
4.2 Experiments with the entropy
method
Because of the strong interest in the detection of
microcalcifications in mammograms , we decided to
test the Vitulano’s method with this kind of signals.
80
100
120
140
160
180
200
220
0 100 200 300 400 500 600
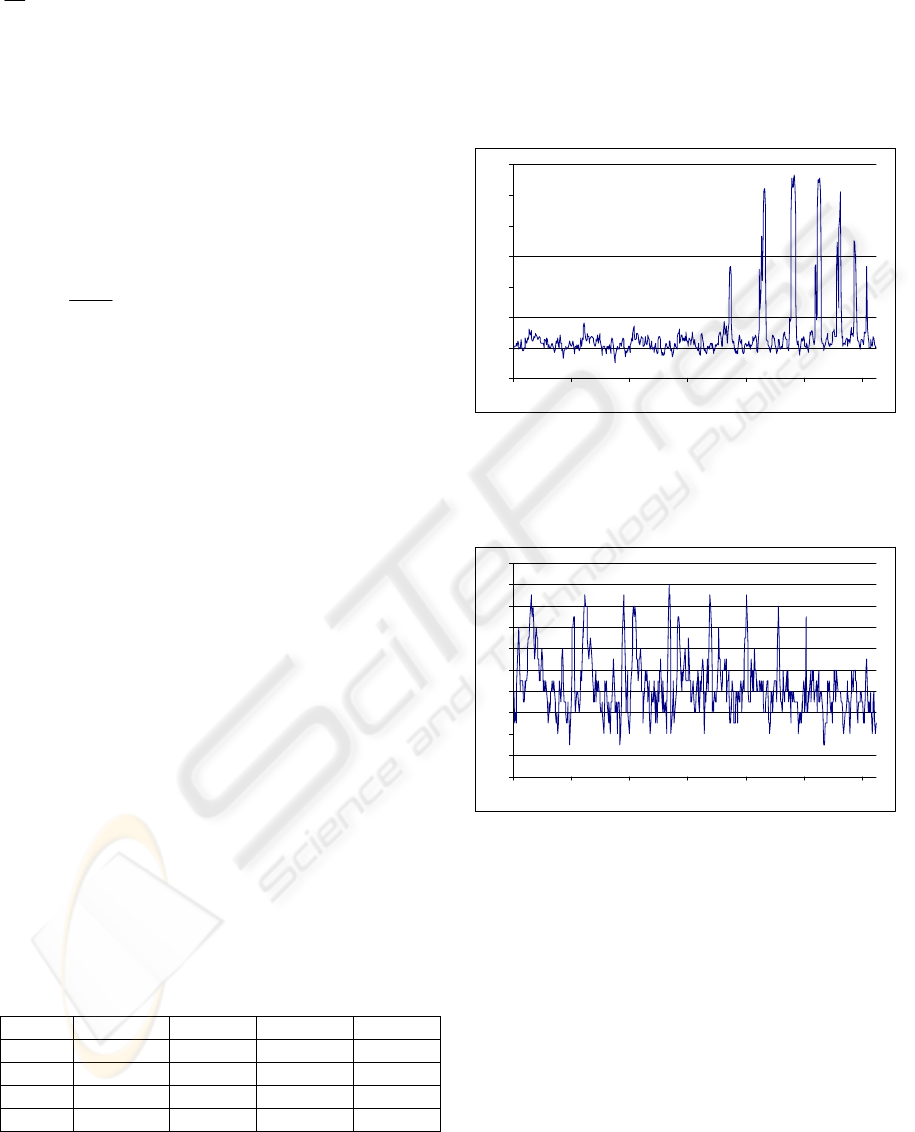
Figure 1a and b: Representation of the signal
(obtained after the application of the spiral path)
related to the parenchymal tissue for a benignant
(top) and for a malignant (bottom)
microcalcification.
205
207
209
211
213
215
217
219
221
223
225
0 100 200 300 400 500 600
The analysis of the signals of the
microcalcifications highlights that for the malignant
cases (Figure 1b) the impulses are characterized by a
small amount of energy (impulse area), a significant
shape and a remarkable value of the entropy in the
bottom of the signal if compared to the signals of the
benignant ones (Figure 1a).
The results are summarized on Table 2
A NOVEL ENTROPY METHOD FOR CLASSIFICATION OF BIOSIGNALS
279

5 DISCUSSION AND FINAL
REMARKS
The experimental results show the role of the
entropy in perception. In particular, the use of the
Fourier transforms, wavelets and high pass filers do
not show good performance unless of ad hoc tuning
of given parameters. In fact, the shape, the power
spectra or the approximation degree of the
polynomial are not characteristics due to the nature
of the signal.
For our purpose the degree of disorder (entropy)
of the image is an important indicator; in fact the
texture disorder (parenchymal tissue structures) in
the suspicious region of the image represents a
significant component for a physician in the
diagnosis of malignancy or benignancy.
The methods proposed in this work get the guide
reasons by observing that, when a malignant lesion
comes up, not only it causes alterations in the
parenchyma, but also increases its level of disorder.
The experimental results are shown in Figure 2;
we selected 175 images corresponding to a
benignant or a malignant microcalcification.
For each sample image we applied HER, by
using the 70% of the crest energy; we wish to
underline the fact that the results don’t change
significantly by assuming the 50% or 90% of the
crest energy.
The graph of Figure 2 shows clearly two
disjoined classes, corresponding to malignant and
benignant microcalcifications.
The analysis of the results show that the number
of the extracted maxima is bigger for a malignant
lesion, but the energy value associated with each of
the maxima is higher for a benignant
microcalcification.
The comparison between the two signals shown
in Figure 1 reveals that even if the number of the
maxima is higher in the malignant lesion, the global
value of the associated energy lessens with respect
to the benignant case. By recurring to the principle
of entropy-disorder we may conclude by saying that
signals related to malignant microcalcifications are
characterized by a bigger amount of the entropy with
respect to benignant ones.
In other words, we feel that the alterations
concerning the same tissue, can be a valid measure
or an increasing of the malignancy of the lesion.
It is remarkable that the entropy measures of the
signal do not require a large amount of operations,
therefore it is less computational time consuming
Malignant Benignant
Method
# Errors Percentage # Errors Percentage
Fourier
70 51% 62 51%
Vitulano’s
Entropy
2 98,4% 3 97,6%
HER
6 96% 5 96%
Fuzzy Entropy
22 85% 6 95%
Table 2: Results due to the Vitulano’s method when applied to microcalcification
ICINCO 2005 - SIGNAL PROCESSING, SYSTEMS MODELING AND CONTROL
280

0
500
1000
1500
2000
2500
3000
3500
4000
4500
5000
30 80 130 180 230 280 330 380
Malignant Benignant
REFERENCES
F. Kossentini, M.J.T. Smith, C.F. Barnes, 1995. Image
coding using entropy-constrained residual vector
quantization. In IEEE Transactions on Image
Processing ,4 , pp.1349-1357
V.Di Gesù, S.Roy, 2000. Fuzzy measures for image
distance, in proc of Advances. In Fuzzy Systems and
Intelligent Technologies , F.Masulli, R.Parenti, G.Pasi
Ed.s, Shaker Publishing , pp.156 -164.
C. Di Ruberto, M. Nappi, S. Vitulano, 1998. Different
Methods to Segment Biomedical Images. In Pattern
Recognition Letters, 18, nos. 11/13, pp. 1125-1131.
Qian Zhao et alt., 2004. Multi-resolution source coding
using Entropy constrained Dithered Scalar
Quantization. In Proc. of DCC’04 IEEE.
M. Toews, t. Arbel, 2003. Entropy of likelihood feature
selection for image correspondence. In Proc. ICCV’03
IEEE.
Melloul M., Joskowicz L., 2002. Segmentation of
microcalcification in X-ray mammograms using
entropy thresholding. In CARS 2002, H.U.Lemke et
al. Editors.
Kullback S.C., 1959. Information Theory and Statisitcs,
New York, N.Y.
E.T.Jaynes, 1962. In Brandies Theor.Phys.Lectures on
Statistical Physics, Vol. 3, New York, N.Y.
E.R.Caianiello, 1983. Theories:Lett.Al Nuovo Cimento,
Vo.38, 539.
A.Casanova, S.Vitulano, 2004.
Entropy As a Feature In
The Analysis And Classification Of Signals. In Series
on Software Engineering and Knowledge Engineering,
N.15 - World Scientific ISBN 981-256-137-4.
Heath M. et alt., 1998. Current status of digital database
for screening mammography, (Kluwer Academic
Pub.), pp. 457-460.
W.Richardson, 1992. Non linear filtering and multiscale
texture discrimination for mammograms. In
Mathematical Methods Med. Imag., Proc. SPIE 1768
pp. 293-305.
A. Laine et alt., 1992. Multiscale wavelet representation
for mammography feature analysis. In Mathematical
Methods Med. Imag., Proc. SPIE 1768 pp. 306-316
W.Qian et alt., 1993. Tree structured non linear filter and
wavelet transform for microcalcification segmentation
in mammography. In Biomedical Iimage Processing
and Biomedical Visualization, Proc. SPIE 1905 pp.
509-520.
Y. Yoshida et alt., 1994. Automated detection of clustered
microcalcifications. In digital mammograms using
wavelet processing techniques in Medical Imaging,
Proc. SPIE 2167pp.868-886.
R.N. Strickland, H.Hahn, 1996. Wavelet Transforms for
detecting microcalcifications. In Mammograms IEEE
Trans. on Medical imaging, Vol.15, No.2
A.Casanova, V.Savona, S.Vitulano, 2004. The Role Of
Entropy. In Signal Analysis And Classification: An
Application To Breast Diagnosis Medicon2004,
Ischia.
A.Casanova, M.Fraschini, 2003. HER: Application on
Information Retrieval. In Series on Software
Engineering and Knowledge Engineering Vol. 15:
150-159 ISBN:981-238-587-8.
Vitulano S.
et alt,. 2000. A hierarchical representation for
content-based image retrieval. In Jour. Of Visual
Lang. and Comp., 5, pp. 317-326.
I.W. Bassel, ,1992. Mammographic analysis of
calcification Radiol. Clin.No.Amer. , Vol. 30 pp 93-
105.
M. Heath, K.W. Bowyer, D. Kopans et alt., 1998. Current
status of the digital Database for Screening
Mammography. In Digital Mammography, Kluwer ,
pp 457-460 Academic Pub.
H. Barman et alt., 1993. Using simple local Fourier
domain models for computer-aided analysis of
mammograms. In Proc. 8
th
Scandinavian Conf. Image
Anal. Norway pp. 479-486.
Figure 2: Graphical representation of the two classes of benignant and malignant microcalcifications.
A NOVEL ENTROPY METHOD FOR CLASSIFICATION OF BIOSIGNALS
281
