
REAL TIME WEB AVAILABILITY OF STATISTICAL MODELS FOR
WATER LEVELS ALONG THE TEXAS COASTLINE
Alex Sadovski
Department of Computing and Mathematical Sciences, Texas A&M University–Corpus Christi
6300 Ocean Dr. Corpus Christi, TX 78412
Carl Steidley
Department of Computing and Mathematical Sciences, Texas A&M University-Corpus Christi
6300 Ocean Dr. Corpus Christi, TX 78412
Philippe Tissot
Department of Physical and Life Sciences, Texas A&M University-Corpus Christi
6300 Ocean Dr. Corpus Christi, TX 78412
G. Beate Zimmer
Department of Computing and Mathematical Sciences, Texas A&M University-Corpus Christi
6300 Ocean Dr. Corpus Christi, TX 78412
Keywords:
Harmonic analysis, prediction, tide chart, multivariate statistical modeling, linear regression, web, forecast,
water level.
Abstract:
Water level forecasts are essential to the success of trade and industry in the Gulf of Mexico, but present
forecasting methodologies do not provide accurate predictions for the Gulf Coast region. Tide charts produced
by harmonic analysis are the existing standard, but these charts only show the effect of astronomical forces
acting upon the water. While this proves to be an accurate predictor for most of the Atlantic and Pacific Coasts,
water level changes along the Texas Coast are strongly effected by meteorological factors and thus require a
modified prediction model, rather than harmonic analysis alone. A web-based tool was created that combines
harmonic analysis with multivariate statistical modeling to predict water levels along the Texas Gulf Coast.
The result is a substantial improvement on the current model with forecasts available via the World Wide Web.
1 INTRODUCTION
The goal of our on-going research is to develop ef-
fective and reliable tools for predicting water levels in
the shallow waters of the Gulf of Mexico. Different
schemes that we are using for the prediction of water
levels include harmonic analysis, statistical models,
and neural networks. Multivariate statistical based
models of predictions of tides and neural network
predictions are under development at the Division of
Nearshore Research and Department of Computing
and Mathematical Sciences of Texas A&M Univer-
sity - Corpus Christi.
Due to the heavy dependence of trade and indus-
try along the Gulf of Mexico coast on water level
forecasts, accuracy in these forecasts is essential, but
the current standard forecasting methodologies do not
provide accurate predictions for this region. Tide
charts, produced by harmonic analysis and published
by the National Ocean Service, are the existing stan-
dard, but these charts only show the astronomical
forces acting upon the water. While this proves to be
an accurate predictor for major portions of the other
coasts, water level changes along the Texas Coast
are strongly effected by meteorological factors (Cox
et al., 2002) and thus require a modified prediction
model. A web-based tool was created that combines
harmonic analysis with multivariate statistical mod-
eling to predict water levels along the Texas Gulf
Coast. The result is a substantial improvement on the
tide charts with forecasts available via the web. Wa-
ter level data used to make these predictions is gath-
ered by the Texas Coastal Ocean Observation Net-
work (TCOON), which is managed by the Division
of Nearshore Research.
218
Sadovski A., Steidley C., Tissot P. and Beate Zimmer G. (2005).
REAL TIME WEB AVAILABILITY OF STATISTICAL MODELS FOR WATER LEVELS ALONG THE TEXAS COASTLINE.
In Proceedings of the Second International Conference on Informatics in Control, Automation and Robotics - Signal Processing, Systems Modeling and
Control, pages 218-223
DOI: 10.5220/0001157502180223
Copyright
c
SciTePress
2 TEXAS COASTAL OCEAN
OBSERVATION NETWORK
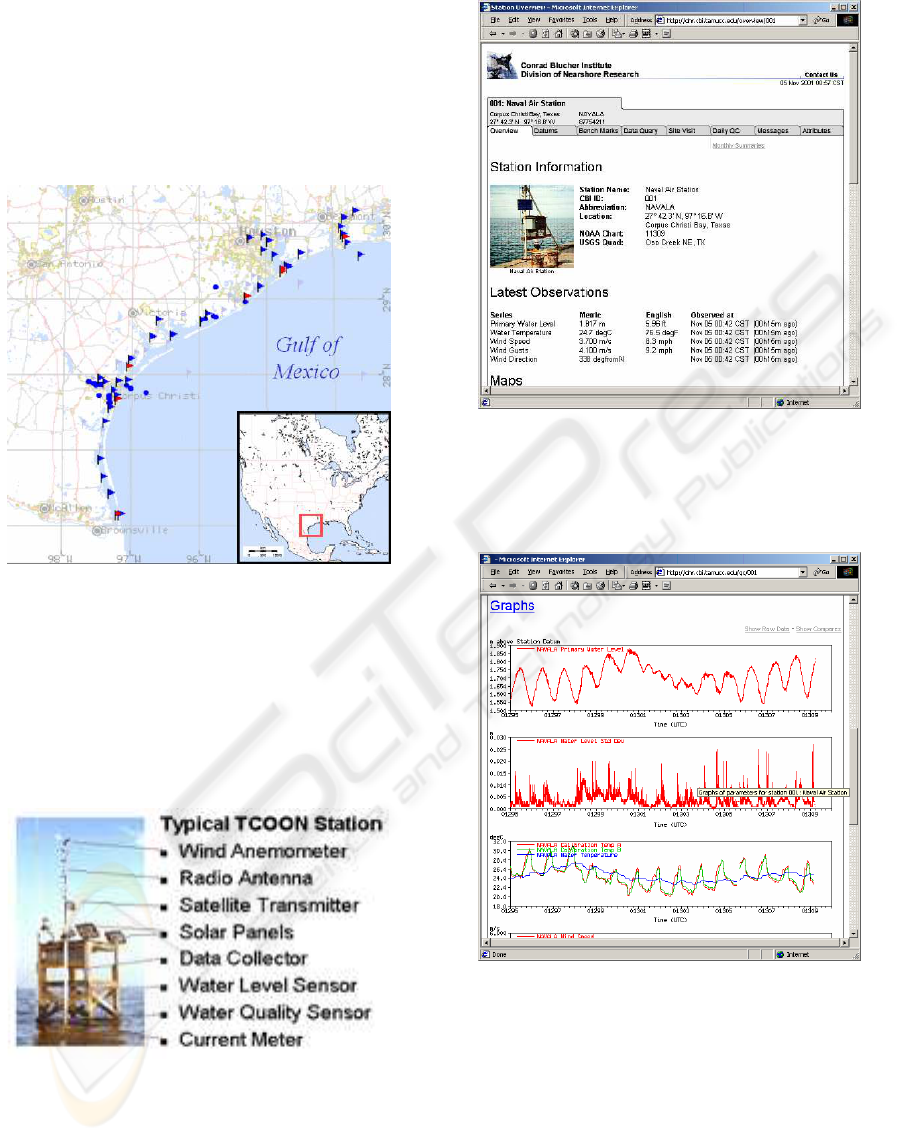
The Texas Coastal Ocean Observation Network
(TCOON) started in 1989 and operates over 50 en-
vironmental data collection platforms along the Gulf
Coast, from Mexico to Louisiana (Fig.1). Primary
Figure 1: Map of TCOON Stations.
project sponsors include the Texas General Land Of-
fice, Texas Water Development Board, U.S. Army
Corps of Engineers, and NOAA National Ocean Ser-
vice. TCOON stations (Michaud et al., 2001) mea-
sure and archive various measurements such as water
levels, wind speed and direction, temperature, salin-
ity, and barometric pressure (Fig. 2). TCOON follows
Figure 2: Typical TCOON station.
U.S. National Ocean Service standards for the instal-
lation of its stations and has a very useful real-time,
online database. TCOON data is valuable for tidal
datum, coastal boundaries, oil-spill response, naviga-
tion, storm preparation and response, as well as re-
search.
Figure 3: TCOON web site: top of the page about station
001: Naval Air Station.
Figure 4: TCOON web site: graphs of water levels, air and
water temperature data for Naval Air Station.
See Figures 3 and 4 for examples of TCOON web
pages. The screen depicted in Figure 3 contains the
latest measurements taken at the selected station. The
screen in Figure 4 depicts an illustration of graphical
representations of TCOON measurements in near-real
time.
REAL TIME WEB AVAILABILITY OF STATISTICAL MODELS FOR WATER LEVELS ALONG THE TEXAS
COASTLINE
219
3 HARMONIC ANALYSIS
According to the Tide and Current Glossary issued by
the National Ocean Service (NOS) in 2000, tide is de-
fined as: The periodic rise and fall of a body of water
resulting from gravitational interactions between Sun,
Moon, and Earth
Thus, changes in water level from non-gravitational
forces are not “tides” but rather “water levels” which
can be defined as:
Astronomical+Meteorological Forcing+Other Effects
Present forecasting methodologies do not provide ac-
curate predictions for the Gulf Coast region, because
of shallow waters in this part of the Gulf of Mexico.
The standard method for tide predictions is harmonic
analysis. Harmonic analysis (HA) (Sadovski et al.,
2003b) is represented by constituent cosine waves
with known frequencies based on gravitational or pe-
riodic forces.
h(t) = H
O
+
X
H
c
f
y,c
cos(a
c
t + e
y,c
− k
c
),
where
h(t) = elevation of water at time t
a
c
= frequency (speed) of constituent c
f
y,c
/e
y,c
= node factors/equilibrium args
H
O
= datum offset
H
c
= amplitude of constituent c
k
c
= phase offset for constituent c
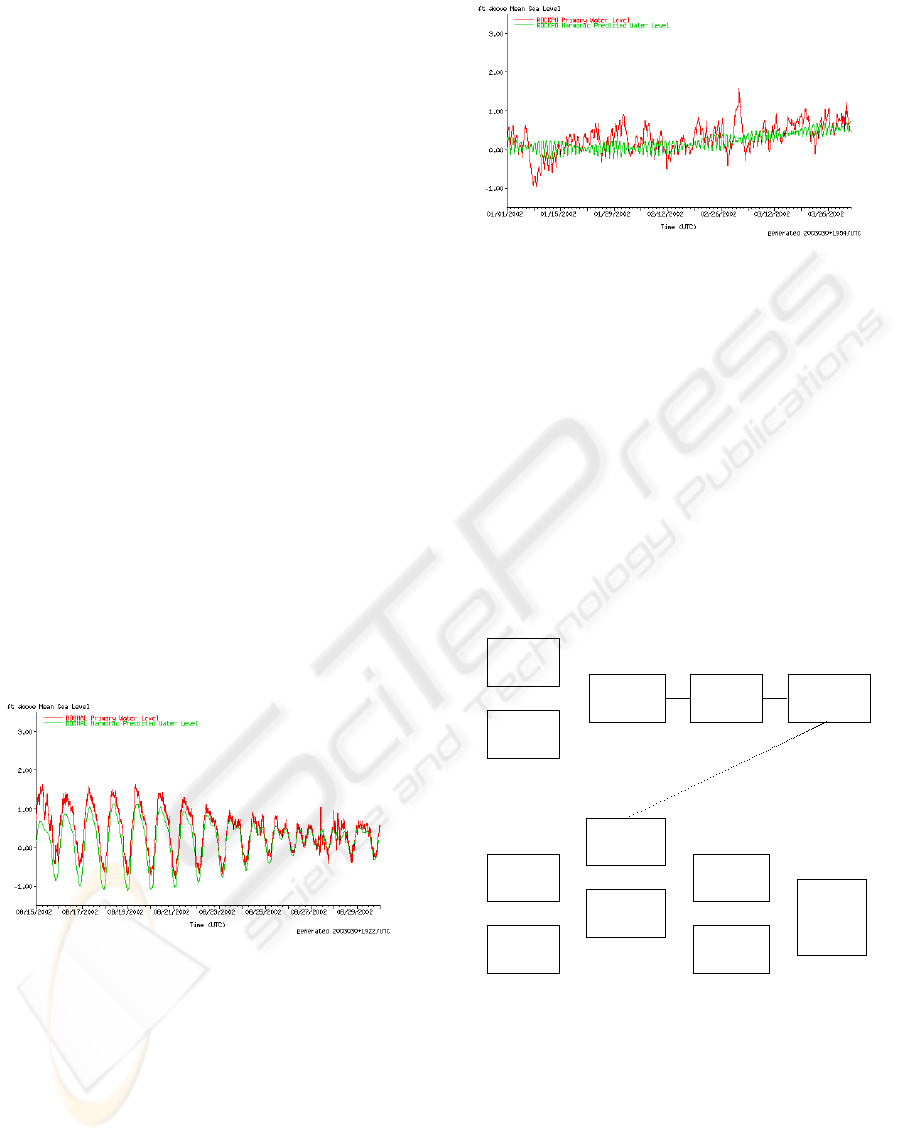
Figure 5: Comparison of water levels measured (red) and
predicted by harmonic analysis (green) at the Bob Hall Pier
Station for part of August 2002. It can be seen that tide
tables provide accurate forecasts when the influence of me-
teorological and other factors is small.
4 IMPROVEMENT OF
PREDICTIONS
Our goal is to develop and compare models forecast-
ing the difference between observed water levels and
Figure 6: Comparison of water levels measured (red) and
predicted by harmonic analysis (green) at the Rockport Sta-
tion for January to March 2002. The large influence of me-
teorological forcing can be observed throughout the period.
the harmonic predictions. Approaches considered in-
clude persistence model, multivariate statistical mod-
eling, and neural networks (Sadovski et al., 2003b),
(Tissot et al., 2002). The models are built and tested
based on the past observations and then applied to
predict future water level differences. The methodol-
ogy to develop and test the new model based on linear
regression is illustrated in Fig 7.
Harmonic
Analysis
Model
Recent
Obser-
vations
@
@R
Recent
Differences
Coefficients
@
@R
Harmonic
Analysis
Forecasts
Predicted
Differences
@
@R
Improved
Water
Level
Forecasts
2. Apply the Model to Produce Forecasts
Harmonic
Analysis
Model
Training
Set Obser-
vations
@
@R
Differences
-
Linear
Regression
-
Coefficients
1. Create the Model
Figure 7: Schematics Illustrating the methodology to de-
velop and test the new water level forecasting models.
We performed a factor analysis of water level data
for over 20 of the TCOON stations, one station at a
time, using water levels over a period of 48 hours with
measurements for every other hour as variables. Data
spanning nearly one year were used for each factor
analysis. The stations included deep water stations
such as Flower Garden near Houston and shallow wa-
ter stations such as Bob Hall Pier near Corpus Christi.
For Bob Hall Pier, four components extracted by Prin-
ICINCO 2005 - SIGNAL PROCESSING, SYSTEMS MODELING AND CONTROL
220

cipal Component Analysis explained 96.2% of the to-
tal variance of the data. A look at the correlation ma-
trix for the four main factors and the variables (Figure
8) shows all positive correlations in the column for
the first component, indicating a non-periodic com-
ponent, whereas for example the pattern of the corre-
lation coefficients for the second component shows a
periodic component.
Component
time t 1 2 3 4
0 .762 -.261 .452 -.276
-2 .777 -.437 .350 -.186
-4 .791 -.543 .160 -.120
-6 .804 -.551 -7.047E-02 -9.277E-02
-8 .815 -.455 -.284 -.113
-10 .825 -.278 -.426 -.174
-12 .833 -5.918E-02 -.462 -.253
-14 .840 .150 -.382 -.323
-16 .846 .303 -.205 -.354
-18 .851 .363 2.348E-02 -.332
-20 .854 .319 .247 -.256
-22 .856 .186 .410 -.139
-24 .857 8.896E-04 .470 4.746E-04
-26 .856 -.185 .411 .140
-28 .854 -.319 .248 .257
-30 .850 -.364 2.372E-02 .333
-32 .845 -.305 -.206 .354
-34 .840 -.153 -.383 .322
-36 .833 5.687E-02 -.464 .253
-38 .824 .276 -.429 .173
-40 .814 .455 -.287 .113
-42 .803 .551 -7.393E-02 9.279E-02
-44 .790 .545 .157 .120
-46 .776 .440 .348 .187
-48 .760 .265 .451 .277
Figure 8: Correlation matrix for the four main components
for Bob Hall Pier.
For the deep water station Flower Garden, five
main components explain 93.8% of the total variance
of the data. The first two components for Flower
Garden are periodic and the third component has all
positive correlation coefficients, indicating that it is a
non-periodic component. We found that at each sta-
tion tested, no more than 5 factors explain over 90%
of the variance for water levels. The periodic main
components could be called “astronomical”, the non-
periodic component that shows mainly in shallow wa-
ters could be called “weather”. For all stations in the
coastal shallow waters and estuaries we found the first
component to be not periodical; hereweather is an im-
portant input for predictions. The other components
are periodical. For the stations on off-shore deep wa-
ters the first two components are astronomical or pe-
riodical.
These conclusions assisted us in improving pre-
dictions in the shallow waters since the conclusion
suggested integrating a regression approach with har-
monic analysis. Namely, we use the idea that vari-
ations of water levels depend on two components -
a harmonic component (tides) and another compo-
nent which is affected by weather. The regression ap-
proach incorporates recent weather and the harmonic
analysis parts accounts for the astronomical compo-
nents. We separate out the weather part as follows:
Let us denote
x
n
= w
n
− h
n
where x
n
is the difference between the actual water
level w
n
and the harmonic forecast h
n
at the moment
n. Then we can apply a bootstrapping technique to
find the next value of x from the water levels of the
preceding n hours. That is, we can predict next hour
difference between water level and harmonic level
x
1
= a
0
x
0
+ a
−1
x
−1
+ . . . + a
−n
x
−n
and step by step
x
k
= a
0
x
k−1
+ a
1
x
k−2
+ . . . + a
−n
x
k−n
.
Now we find the prediction for water levels as by
adding the harmonic forecast h
t
to the forecasted dif-
ference x
t
w
t
= h
t
+ x
t
.
This symbiosis of regression and harmonic analysis
approach to the predictions of water levels proved to
be very effective.
5 MODEL PERFORMANCE
ASSESSMENT
Once water level predictions are developed,
they are evaluated based on a suite of Na-
tional Ocean Service Skill Assessment Statistics.
Error predicted value − observed value
SM series mean
RMSE root mean square error
SD standard deviation
CF(X) central frequency;
% of errors between −X and X
POF(2X) positive outlier frequency
NOF(2X) negative outlier frequency
MDPO(2X) max. duration of positive outlier
MDNO(2X) max. duration of negative outlier
A web-based tool (see Figure 9) was created that
combines harmonic analysis with multivariate sta-
tistical modeling to predict water levels along the
Texas Gulf Coast. Water level predictions, as well
as skill assessment statistics, are dynamically gener-
ated based on a set of user given criteria including
station identifier, dates, number of coefficients (that
REAL TIME WEB AVAILABILITY OF STATISTICAL MODELS FOR WATER LEVELS ALONG THE TEXAS
COASTLINE
221
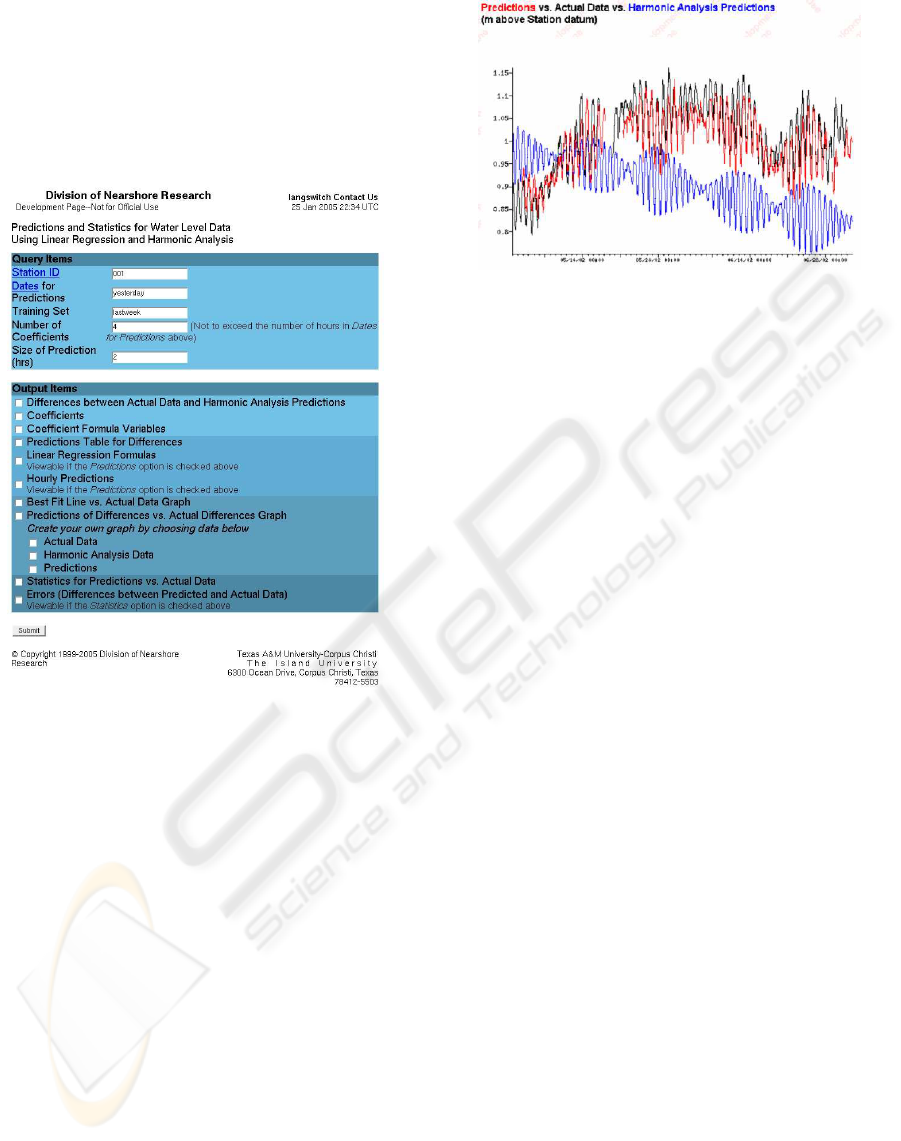
is, the number of hours) of linear regression, and a
prediction range. The programming was done as CGI
scripts in Perl using the Perl Data Language (PDL)
and inputs from the TCOON database. The tool is
available on the web and can be used for any TCOON
station.
Figure 9: Web based tool to generate water level
predictions at the TCOON stations using a symbio-
sis of harmonic forecasts and linear regression. Lo-
cation: http://wip.cbi.tamucc.edu/∼jessica/pharosdb/cgi-
bin/excel/sdiffcoeff.cgi (Development page)
6 MODEL PERFORMANCE
Using the previously described web based tool, fore-
casts were computed for the Packery Channel Station,
near Corpus Christi, Texas. A graphical comparison
between harmonic analysis forecasts, observed water
levels and model predictions is presented in Figure
10. As can be observed in the figure model fore-
casts result in a substantial improvement over har-
monic analysis. The performance improvement is fur-
ther quantified using the NOS skill assessment criteria
described above. Here are the National Ocean Service
Skill Assessment Statistics for the given example:
Figure 10: Comparison of Predictions with the Measured
Water for Packery Channel 05/01/02-06/31/02
SM (predicted) 0.996
SM (actual) 0.995
RMSE 0.159
SD 0.159
CF (15 cm) 97.64%
POF (30 cm) 2.35%
NOF (30 cm) 0.00%
MDPO (30 cm) 24
MDNO (30 cm) 0
The advantage of this model is its stability; the
quality of its forecasts are close to the quality of
forecasts obtained with neural networks in (Sadovski
et al., 2003b).
7 FURTHER MODEL
DEVELOPMENT
Apart from being used as a forecast tool, this mod-
eling technique has also been adapted to the problem
of filling gaps. Gaps in the water level time series
occur due to equipment failure, etc. Figure 11 de-
picts data collected at the Texas State Aquarium sta-
tion with a gap spanning over 24 hours during Janu-
ary 2003. Linear interpolation of the data would not
adequately fill the gap. Forward and backward linear
regression are applied to complete the water level data
sets. Other current work involves further development
of the multivariate statistical model and comparisons
at various locations along the Texas Gulf coast with
harmonic analysis and other forecasting methodolo-
gies such as the persistence and neural network mod-
els (Sadovski et al., 2003a). Future work will general-
ize the forecast capabilities to points along the Texas
coast that lie between TCOON stations.
ICINCO 2005 - SIGNAL PROCESSING, SYSTEMS MODELING AND CONTROL
222
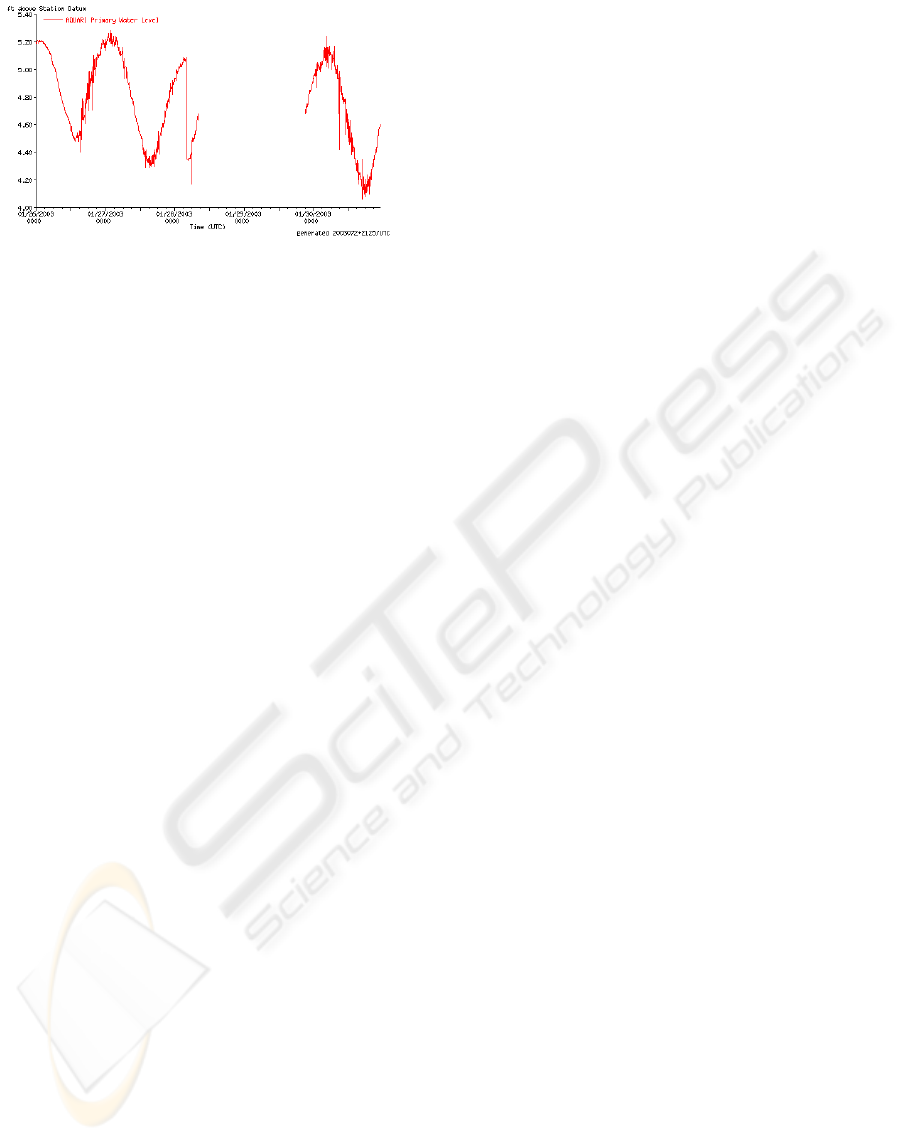
Figure 11: Example of a gap in a water level time series to
be filled by the forward/backward linear regression method
8 SPONSORS AND RESOURCES
The work presented in this paper is funded in part by
the following federal and state agencies of the USA
- National Aeronautic and Space Agency (NASA
Grant #NCC5-517)
- National Oceanic and Atmospheric Administration
(NOAA)
- Texas General Land Office - Coastal Management
Program (CMP)
The following are the web based resources:
- Division of Nearshore Research Website
http://dnr.cbi.tamucc.edu
- TCOON Data Query Page
http://dnr.cbi.tamucc.edu/pquery
- Web-based Predictions Development Page
http://wip.cbi.tamucc.edu/∼jessica/pharosdb
/cgi-bin/excel/sdiffcoeff.cgi
REFERENCES
Cox, D., Tissot, P., , and Michaud, P. (2002). Water
level observations and short term predictions includ-
ing meteorological events for the entrance of Galve-
ston Bay,Texas. Journal of Waterways, Port, Coastal
and Ocean Engineering, 28(1):21–29.
Michaud, P., Jeffress, G., Dannelly, R., and Steidley, C.
(2001). Real time data collection and the Texas
Coastal Ocean Observation Network. In Proc. Inter-
national Measurement and Control (InterMAC).
Sadovski, A. L., C.Steidley, Tissot, P., and Michaud, P.
(2003a). Developing a goodness criteria for tide pre-
dictions based on fuzzy preference ranking. In Devel-
opments in Applied Artificial Intelligence. Springer.
Sadovski, A. L., Tissot, P. E., Michaud, P., and Steidley, C.
(2003b). Statistical and neural network modeling and
predictions of tides in the shallow waters of the Gulf
of Mexico. In WSEAS Transactions on Systems.
Tissot, P., Cox, D., and Michaud, P. (2002). Forecasting of
storm surges along the Gulf of Mexico. In Proceed-
ings of the Fourth International Symposium on Ocean
Wave Measurement and Analysis (Waves ‘01).
REAL TIME WEB AVAILABILITY OF STATISTICAL MODELS FOR WATER LEVELS ALONG THE TEXAS
COASTLINE
223
