
BROKEN BAR DETECTION IN INDUCTION MOTORS
Using non intrusive torque estimation techniques
Eltabach Mario
Université Saint-Esprit de Kaslik, USEK Faculté des sciences et de génie informatique ; BP446 Jounieh, Liban
Charara Ali
HEUDIASYC UMR 6599; Université de Technologie de Compiègne BP 20529, 60205 Compiègne; Compiègne, France
Keywords: Diagnosis, control, supervision systems, Observers, signature analysis, Induction motors.
Abstract: One of the most important issues when implementing control and fault diagnosis systems for induction
motor drives is obtaining accurate information about the state of certain motor electromagnetic signals such
as stator flux and electromagnetic torque. This paper examines the detection of rotor imperfections through
spectral analysis of the electromagnetic torque, computed by three stator flux estimators, and using only
non-invasive sensors such as current and voltage sensors. The variable structure observer, the extended
Luenberger observer (ELO) and extended Kalman filter (EKF) are used to estimate flux components
without resorting to the use of intrusive speed sensors. The aim of this paper is to make a comparison and a
classification between these approaches. Experimental results demonstrate the significant potential of these
methods in detecting these types of faults.
1 INTRODUCTION
Rotor asymmetries in induction machines, for
example as a result of broken rotor bars, lead to
perturbations in air gap patterns and electromagnetic
torque. Over the last twenty years various
monitoring and diagnostic strategies have been
proposed for the diagnosis of problems in induction
motors. These strategies are usually based on the
spectral analysis of electrical signatures such as
stator currents (Kliman 1992), partial powers
(Stanislaw,1996), Park’s vector modulus (Cardoso,
1993), (Cruz, 2000) or the electromagnetic torque
(Kral, 2000), (Trzynadlowski, 2000), (EL Tabach,
2002). Direct measurement of magnetic field using
search coils or Hall-effect sensors means implanting
sensors in the air gap of the machine, which leads to
increased complexity. Moreover, these sensors are
prone to errors caused by temperature variation,
noise, etc (Janson, 1992). In order to elaborate only
non-invasive diagnostic methods, the
electromagnetic torque (EMT) is estimated using
internal diagnostic methods. These methods use
electrical parameters and a model of the machine in
order to estimate state components such as stator or
rotor flux, or the electromagnetic torque (EMT). The
estimation of these state components requires the
measurement of all the three currents and voltages
which will be much expensive than the simple
current spectrum techniques. However, if
implemented in a Variable Frequency Drive “VFD”
where current and voltage measurement are already
taken, the incremental cost is limited and these
drives will provide accurate systems for mechanical
faults detection and diagnosis. Some writers like in
(Trzynadlowski, 1999) and (Kral, 2000) study the
spectral analysis of the electromagnetic torque
(EMT) computed from estimations of stator flux and
measurements of stator current. This method
involves estimating the stator flux without any
correction step, which means that the accuracy of
flux estimation is low. Others, like Eltabach (EL
Tabach, 2002), have proposed analyses of the EMT
deduced from the observed rotor flux using linear
observers as the Luenberger Observer, and Kalman
filtering.
This article widen the idea in (Eltabach, 2002), in
fact first, this article treats a new approach using a
sliding mode observer applied to the complete order
model of induction machines, without sensing or
estimation of speed. This design strategy considers
144
Mario E. and Ali C. (2005).
BROKEN BAR DETECTION IN INDUCTION MOTORS - Using non intrusive torque estimation techniques.
In Proceedings of the Second International Conference on Informatics in Control, Automation and Robotics - Robotics and Automation, pages 144-149
DOI: 10.5220/0001156901440149
Copyright
c
SciTePress

the non-linear induction motor dynamic system as a
linear system subjected to bounded uncertainties due
mainly to variations in both speed and stator
resistance. This offers a number of advantages
including simplicity, parameter-insensitivity, and
noise rejection. Secondly this article aims to make a
comparison and a classification between this new
approach and the previous work concerning the
EMT estimation methods.
In this paper, section 2 reviews the complete linear
model, the complete motor model extended to the
velocity and the resistive torque, the sliding mode
observer structure, the Luenberger observer and
finally the Kalman filtering. Experimental results
and a comparison of the detection approaches, for
detecting one and two broken bars at three load
levels, are presented in section 3.
2 THEORETICAL
BACKGROUND
The electromagnetic torque of an induction motor
can be computed from certain known motor
variables such as stator currents and rotor flux, or
stator currents and stator flux. Stator flux can be
computed from model-based observers such as the
sliding mode observer and the Luenberger observer
as a deterministic variable structure approach, and
the Kalman filter as a stochastic approach. In this
paper we shall deal with both these approaches using
the fourth-order model of the induction motor,
without resorting to the use of intrusive speed
sensors physically integrated into the machine.
2.1 Fourth-order induction motor
model
The fourth-order model is obtained by considering
the stator voltages as input and the stator currents as
output. The state vector consists of the currents and
stator flux components. This model is deduced from
a Park transformation and presented in a d-q plane
rotating at velocity w
x
. With these assumptions, and
assuming the mechanical velocity is known, the
linear fourth-order model of the machine can be
obtained:
⎪
⎩
⎪
⎨
⎧
=
+=
44
44444
XCy
UBXAX
(1)
With
[]
T
sqsdsqsd
IIX ΦΦ=
4
,
T
sqsd
VVU ][=
,
T
sqsd
IIy ][=
⎥
⎥
⎥
⎥
⎥
⎥
⎥
⎦
⎤
⎢
⎢
⎢
⎢
⎢
⎢
⎢
⎣
⎡
−
−
−
−
+
−−
−−
+
−
=
0
0
0
0
)(
)(
)(
4
x
w
x
w
m
w
r
L
s
L
s
L
r
R
r
L
s
R
x
w
m
w
m
w
x
w
m
w
r
L
s
L
s
L
r
R
r
L
s
R
A
s
s
rs
r
s
srs
r
R
R
LL
R
L
LLL
R
σσ
σσ
σ
σ
(2)
T
s
L
s
L
B
⎥
⎥
⎥
⎥
⎦
⎤
⎢
⎢
⎢
⎢
⎣
⎡
=
10
1
0
010
1
4
σ
σ
,
⎥
⎦
⎤
⎢
⎣
⎡
=
0010
0001
4
C
,
mm
Pw
Ω
=
,
S
r
L
L
−=1
σ
(3)
R
s
, R
r
, L
fs
, L
r
P,
Ω
m
are respectively the stator
resistance, rotor resistance, total leakage inductance,
rotor inductance, number of pole pairs, and
mechanical velocity.
If the uncertain parameters are split into two parts,
the first corresponding to nominal operation and the
second to unknown behaviour, the system model (1)
can be restated as follows:
⎪
⎩
⎪
⎨
⎧
=
∆+∆++=
44
).(
4
).(
4444
XCy
UtBXtAUBXAX
(4)
4
A
and
4
B
are respectively the nominal state and
input matrixes, which are assumed to be known.
)(tA
∆
and
)(tB
∆
represent the uncertainties on
4
A
and
4
B
due to unmodeled behaviour or parameter
drift.
2.2 Extended non-linear induction
motor model
To obtain a complete extended model for stator flux
and mechanical velocity we consider as in (1) the
stator voltages as input
T
sqsd
VVU ][=
and the
stator currents as output
T
sqsd
IIy ][=
. While the
state vector (
ζ
) consists of the stator current
components, stator flux components, mechanical
velocity, and finally the resistive torque:
T
rmsqsdsqsd
CwII ][ ΦΦ=
ζ
. With these
assumptions, we obtain non-linear extended motor
model:
⎪
⎩
⎪
⎨
⎧
=
+=
)(
).()(
.
ζ
ζζζ
hy
Ugf
(5)
where
BROKEN BAR DETECTION IN INDUCTION MOTORS - Using non intrusive torque estimation techniques
145

⎥
⎥
⎥
⎥
⎥
⎥
⎥
⎥
⎦
⎤
⎢
⎢
⎢
⎢
⎢
⎢
⎢
⎢
⎣
⎡
−−−
−−
+−
−++−
−−−−
=
0
)(
)(
)(
5564413323
326
416
41532215
54231251
ζζζζζζ
ζζ
ζζ
ζζζζζζ
ζζζζζζ
ζ
aaaa
wa
wa
aabwP
aawPb
f
x
x
x
x
srr
LLL
a
−
=
2
1
,
rsrrs
RaaLRLRab .),.(
1
=
+
=
0,
1
,
.2
3
,
5
0
4
0
32
==== a
J
a
J
aPaLa
r
,
⎥
⎥
⎥
⎥
⎦
⎤
⎢
⎢
⎢
⎢
⎣
⎡
=
0010
1
0
00010
1
)(
fs
fs
L
L
g
ζ
,
⎥
⎦
⎤
⎢
⎣
⎡
=
2
1
)(
ζ
ζ
ζ
h
(6)
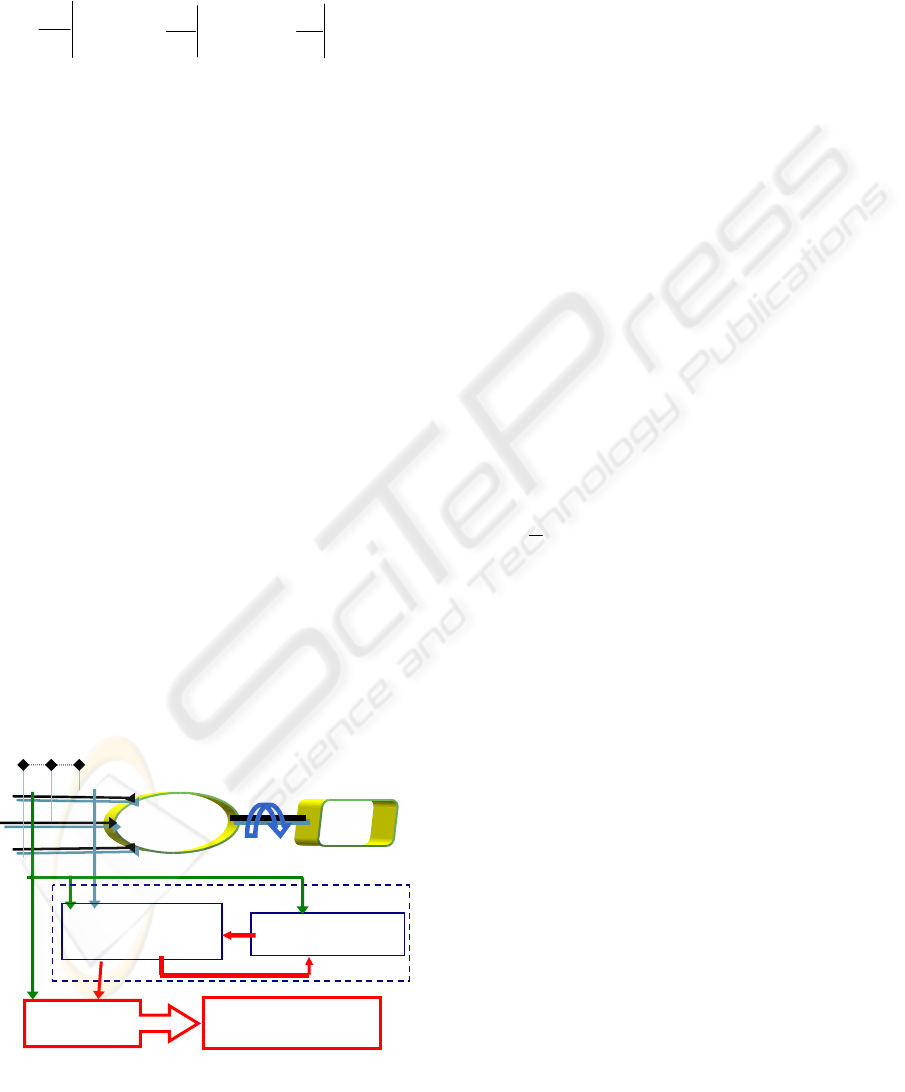
2.3 Sliding mode observer structure
The principal objective of a sliding mode observer
(SMO) structure is to force the observation error to
converge to zero by tracking the system output
variable, which in our case corresponds to the two
stator current components (see Figure 1). In other
words, the idea is to track the stator current
components by putting the corresponding current
errors into sliding mode, hence ensuring the
asymptotic convergence of the flux observation
errors, despite the stator resistance and the
mechanical velocity variations. The observer is
based on the nominal part of the rearranged stator
flux model, with stator current and voltage
measurements as inputs. The system model is then
split into two coupled subsystems: the first
corresponding to the measurable stator currents, and
the second to the stator flux components to be
reconstructed. The proposed SMO has the following
structure:
)sgn(
ˆˆ
)sgn(
ˆˆ
222,422212,4
112,412111,4
sKUBXAyAX
sKUBXAyAX
+++=
+++=
(7)
where (
1,4
ˆ
Xy =
) and
2,4
ˆ
X
are the estimated stator
current and flux components respectively:
t
qsds
iiX ]
ˆˆ
[
ˆ
1,4
=
,
t
qsds
X ]
ˆˆ
[
ˆ
2,4
φφ
=
(8)
⎥
⎦
⎤
⎢
⎣
⎡
=
2221
1211
4
AA
AA
A
,
⎥
⎦
⎤
⎢
⎣
⎡
=
2
1
4
B
B
B
,
0
22
=A
,
22
IB =
(9)
The vector “s” is the stator currents subsystem
switching function. It is directly related to the stator
currents observation error. “K
1
” and “K
2
” are gain
matrixes to be designed. For more details on the gain
design procedure, one can refer to (Kheloui., 2000).
2.4 Luenberger observer
The deterministic discrete time model of the
machine is deduced from system (5) by
discrimination to the first-order approximation:
⎩
⎨
⎧
==
=+=
+
kkkk
kkdkekk
ChY
UfT
ζζ
ζζζζ
.)(
),(
1
(10)
Indices k and k+1 refer to the variable values at “t
k
”
and “t
k+1
” respectively. “T
e
” denotes the sampling
period in milliseconds. Before applying the
Luenberger estimation procedure, the nonlinear
model (10) must be linearized. The linearization of
this non linear model is given by (11) by calculating
the following Jacobians (12):
⎪
⎩
⎪
⎨
⎧
=+=
+==
+
kkkkk
kkkkkkdk
CVhY
UBAUf
ζζ
ζζζ
.)(
ˆ
ˆ
),(
1
(11)
kk
d
k
f
A
ζζ
ς
ˆ
ˆ
=
∂
∂
=
kk
U
f
B
d
k
ζζ
ˆ
ˆ
=
∂
∂
=
kk
h
C
k
ζζ
ζ
ˆ
=
∂
∂
=
(12)
The Luenberger state vector estimation method
consists of two phases. First, the state is predicted
according to the model given in (13).
⎪
⎩
⎪
⎨
⎧
=
=
+
+
)
ˆ
(
ˆ
)
ˆ
(
ˆ
//1
//1
kkkk
kkdkk
hY
f
ζ
ζζ
(13)
Then the predicted state vector is corrected by
injecting the output estimation error:
)
ˆ
(
ˆˆ
/11/11/1 kkkluenbkkkk
YYK
+++++
−+=
ζζ
(14)
The gain “K
luenb
” is calculated by pole placement
using the command “PLACE” from “MATLAB”.
2.5 Kalman Filter
The stochastic discrete time model of the machine is
deduced from system (5) by discrimination to the
first-order approximation, taking state and
measurement noises into account:
⎩
⎨
⎧
+=+=
+=++=
+
kkkkkk
kkkdwkekk
VCVhY
WUfWT
ζζ
ζζζζ
.)(
),(
1
(15)
{
}
{
}
t
kkk
t
kkk
VVERWWEQ == ,
(16)
“W
k
” and “V
k
” are the state and measurement noises
respectively. We suppose that these noises are white,
Gaussian and zero-mean. These noises are defined
by their covariance matrices (Q
k
, R
k
). For simplicity,
they are taken to be diagonal matrices. Before
applying the Kalman filter procedure, the nonlinear
ICINCO 2005 - ROBOTICS AND AUTOMATION
146
model (15) must be linearized (17) as in the
Luenberger observer procedure (19):
⎪
⎩
⎪
⎨
⎧
+=+=
++==
+
kkkkkk
kkkkkkkdk
VCVhY
WUBAUf
ζζ
ζζζ
.)(
ˆ
ˆ
),(
1
(17)
kk
d
k
f
A
ζζ
ζ
ˆ
ˆ
=
∂
∂
=
kk
U
f
B
d
k
ζζ
ˆ
ˆ
=
∂
∂
=
kk
h
C
k
ζζ
ζ
ˆ
=
∂
∂
=
(18)
The KF consists of two phases. First, the state is
predicted according to the model given in (19).
⎪
⎩
⎪
⎨
⎧
=
=
+
+
)
ˆ
(
ˆ
)
ˆ
(
ˆ
//1
//1
kkkk
kkdkk
hY
f
ζ
ζζ
(19)
Subsequently, this prediction is corrected by
injecting the output estimation error:
)
ˆ
(
ˆˆ
/111/11/1 kkkkkkkk
YYK
++++++
−+=
ζζ
(20)
Indices (k+1)/k and (k+1)/k+1 means respectively
the estimated and the corrected value at t
k+1
. For
more details on this estimator see (Eltabach, 2002).
Finally, the Open Loop method of the state
estimation consists only of the first phase of the
Kalman filter, that is to say without any correction
of the state.
3 EXPERIMENTAL SETUP
The experimental tests were carried out using data
from the University of Poitiers (France)
downloadable from http://laii.univ-poitiers.fr/. The
equipment used:
1- Motor: 220/380 V; 50 Hz; 1.1 kW; P=2.
2- Electrical parameters of the motor: R
s
=11 Ω,
R
r
=3.75 Ω, L
fs
=0.04H, L
r
=0.47 H
3- Three voltage sensors
4- Three current sensors
5- An incremental position sensor (2048-point).
The measured signal-sampling period was 0.7 ms.
The detection tests were performed with the
equipment described above, first using an
undamaged motor, subsequently motor with one and
finally two broken bars. In each case three different
levels of load full, medium and low were used,
corresponding to 100%, 60% and 22% of the
nominal torque respectively.
3.1 Electromagnetic torque spectral
analysis
The spectrum of the instantaneous electromagnetic
torque contains a signature related to the mechanical
fault. In fact, broken rotor bars give rise in the
torque’s spectrum to a component of frequency
“2sf”, “f” being the fundamental frequency and “s”
the slip.
The electromagnetic torque can be obtained by
multiplying stator flux and stator currents. In order
to avoid measuring stator flux, the components of
the stator flux can be estimated by approaches
including Kalman filtering and observers. An
estimated torque can be computed from the
following equation:
(
)
sd
I
sqsq
I
sd
P
C
em
Φ−Φ=
ˆˆ
2
3
(21)
where
sqsd
φφ
ˆ
,
ˆ
are the estimated stator flux
components.
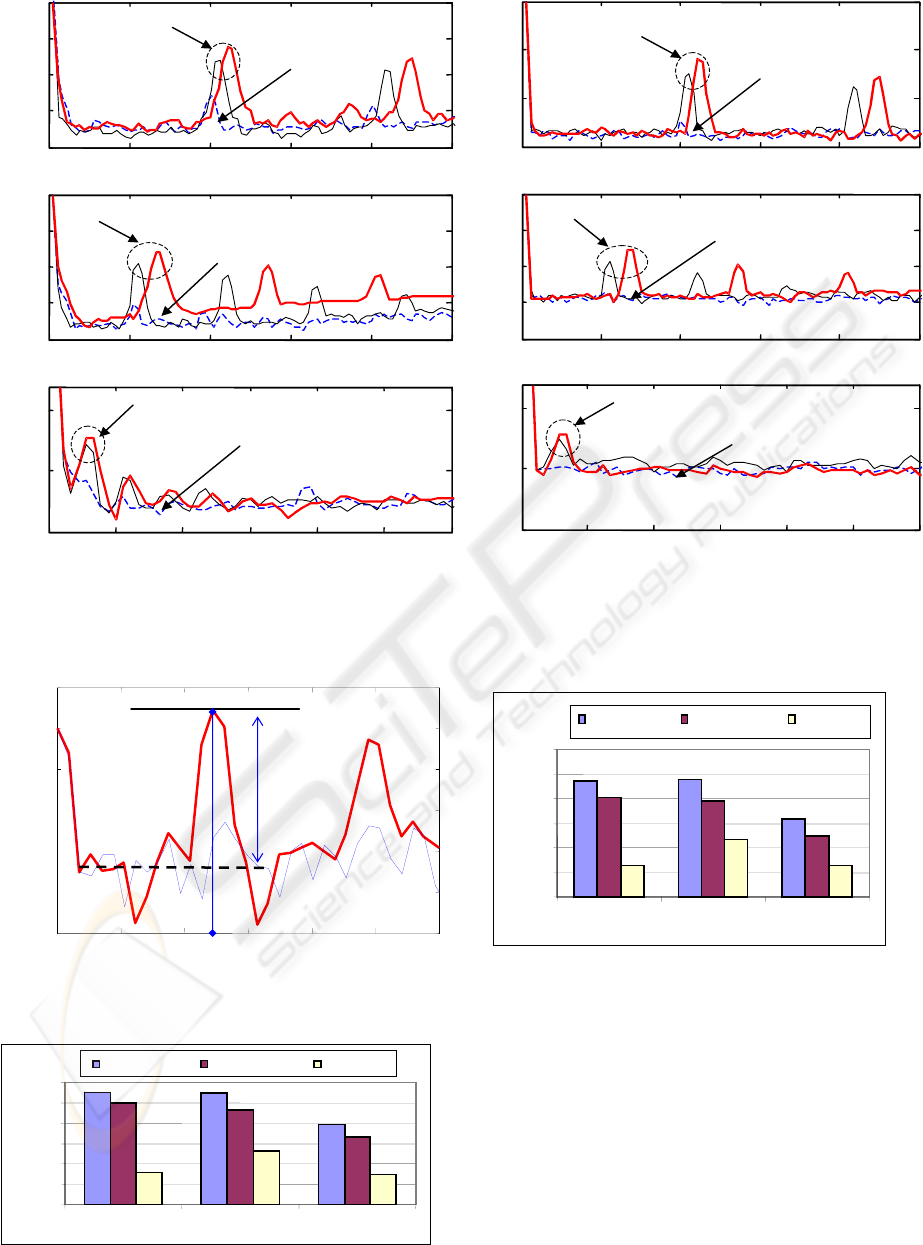
Figures (2a, 2b, 2c) show the normalized spectrum
(in dB) with respect to its mean value, computed
from the stator currents and estimated stator flux
using the extended Kalman filter estimation method
at three different load levels. Figures (3a, 3b, 3c)
show the normalized spectrum computed from the
estimation of stator flux using the sliding mode
observer. The experimental results for EKF, ELO
and SMO clearly reveal the existence of spectral
peaks at a fault characteristic frequency “2sf” when
broken bars are present. When two bars are broken
this frequency takes the value of 4.5 Hz, 2.7 Hz, 0.6
Hz for full, medium, and low load levels
respectively. In the presence of just one broken bar
the corresponding values are 4.2 Hz, 2.2 Hz, 0.5 Hz.
Notice that the amplitude of the fault characteristic
frequency “2sf” is directly linked to the severity of
the fault. In other words, this amplitude for all three
load levels is more pronounced in the case of two
broken bars than when there is just one broken bar.
Torque
i
Motor
Load
i
V
Vcb
Figure 1: Experimental setup
torque
com
p
utation
diagnostic methods
(
DSP
,
..
)
I
Observer
Stator flux model
Nominal
p
art
)
ˆ
(
s
s
IIK −
I
BROKEN BAR DETECTION IN INDUCTION MOTORS - Using non intrusive torque estimation techniques
147
0
20
40
60
80
100
120
Amplitude( dB)
Full load Medium load Low load
ELO EKF SMO
Figure 6: Comparison criterion values « R » at three load
levels in case of two broken bar, and function of the
estimation method.
Figure 4: Comparison criterion
0 2 4 6 8 10
1
-100
-80
-60
-40
-20
0
20
Amplitude( dB)
f
0
P
Ps-M
Frequency (Hz)
0
20
40
60
80
100
120
Amplitude( dB)
Figure 5: Comparison criterion values « R » at three
load levels in case of one broken bar, and function
of the estimation method.
Methods
Full load Medium load Low load
ELO EKF
SMO
Figure 3: Torque spectrum calculated from stator flux
using SMO (thick line: two broken bars, thin line: one
broken bar, dashed: fault-free) for load levels: a. Full,
b. Medium, c. Low
Figure 2: Torque spectrum calculated from stator flux
using EKF (thick line: two broken bars, thin line: one
broken bar, dashed: fault-free) for load levels: a. Full, b.
Medium, c. Low
0
2
4
6
8
10
-
100
-
50
0
50
100
0
2
4
6
8
10
-
100
-
50
0
50
100
0
1
2
3
4
5
6
-
100
-
50
0
Frequency (Hz)
Without fault
2sf
Without fault
2sf
Without fault
2sf
a:
b:
c:
Amplitude( dB) Amplitude( dB) Amplitude( dB)
0
2
4
6
8
10
-50
0
50
100
0
2
1
2
0
6
8
10
-100
-50
0
50
100
0
1
2
3
4
5
6
-100
-50
0
a:
b:
c:
Without fault
2sf
Without fault
2sf
Without fault
2sf
Frequency (Hz)
Amplitude( dB)
Amplitude( dB)
Amplitude( dB)
ICINCO 2005 - ROBOTICS AND AUTOMATION
148

3.2 Comparison
The spectral analysis of the estimated
electromagnetic torque computed by different
methods clearly shows that when a rotor fault is
present a component appears at the fault’s
characteristic frequency « f
0
=2sf» and his amplitude
is directly linked to the severity of the fault. In order
to elaborate motor mechanical diagnosis, a criterion
“R” is used to represent the severity of the
mechanical fault see Figure 4.
M
s
PR −=
in dB (22)
“P
s
” is the amplitude of the fault characteristic
frequency. “M” is the spectrum average, for a fault-
free motor, in the range where the fault characteristic
frequency may occur. In our case the range is [0.3
Hz, 5 Hz], corresponding to the fault characteristic
frequency at no load and at 120% of the motor
nominal load. Figure 5 and Figure 6 show a
comparison between all the three diagnosis methods
with respect to the comparison criterion “R”, at three
load levels in case of one Figure 5 and two broken
bars Figure 6. Experimental results clearly show that
the EKF and ELO methods are better able than the
SMO observer to detect broken bars at all load
levels. EKF and ELO detection methods were
comparable as regards their capacity to detect
mechanical faults, although EKF displayed a much
higher comparison criterion at low load levels.
4 CONCLUSION
This paper has treated a new detection approach
using a sliding mode observer and compared three
non-invasive approaches for the detection of rotor
imperfections. In a first approach, the sliding mode
observer (SMO) is used to estimate stator flux
components in the absence of any speed sensing or
speed estimation. The second approach uses an
extended Kalman filter (EKF) and the third approach
uses an extended Luenberger observer for flux
components and velocity estimation. Experimental
results using real electrical signals (assuming no
change in motor parameters) show the importance of
using the Kalman filter to estimate the
electromagnetic torque, which can provide more
effective detection of rotor faults even at low load
levels. We are currently concentrating on the
sensitivity of these two approaches to natural
variations in electrical parameters, which can
sometimes give rise to false alarms.
REFERENCES
Cardoso, A.J.M., 1993. Computer-Aided Detection of
Airgap eccentricity in operating three phase
induction’s Motors by park vector Approach. In IEEE
Transactions on Industry Applications, vol. 29 N° 5,
pp. 897–901.
Cruz, S.M.A et al., 2000. Rotor cage Fault Diagnosis in
three-phase induction Motors by Extended Park’s
Vector Approach. In Electric Machines and Power
Systems, vol. 28, pp.289-299.
El tabach, M., 2002. Detection of induction motors broken
bars by electromagnetic torque estimation using
Kalman filtering. In EPE-PEMC, 10th International
Power Electronics and Motion Control conference,
Dubrovnik, Croatia.
Janson, 1992. A physically insightful approach to the
design and accuracy assessment of flux observers for
field oriented induction machine drives. In IEEE – IAS
Annual meeting record, pp. 570-577.
Kheloui, A., 2000. Design of a stator flux sliding mode
observer for direct Torque control of Sensorless
induction machine. In IEEE Industry Application
Conference, vol. 3, pp.1388-1393
Kliman, G.B., 1992. Methods of motor current signature
Analysis. In Electric Machines and Power Systems.
Vol. 20 N° 5 , pp. 463-474.
Kral, Ch., et al., 2000. Sequences of field-oriented Control
for the detection of faulty rotor Bars in induction
Machines, the Vienna monitoring method. In IEEE
Transactions on Industrial Electronics, vol. 47 N° 5,
pp. 1042-1050.
Stanislaw, F. et al., 1996. Instantaneous Power as a
medium for the signature analysis of induction
Motors. In IEEE Transactions on Industry
Applications, vol 32 N° 4, pp. 904-909.
Trzynadlowski, A.M et al., 2000. Comparative
Investigation of Diagnostic Media for Induction
Motors: a case of rotor cage faults. In IEEE
Transactions on Industrial Electronics, vol. 47, pp.
1092 –1099.
BROKEN BAR DETECTION IN INDUCTION MOTORS - Using non intrusive torque estimation techniques
149
