
SPATIAL APPROACH IN RIVER BASIN MANAGEMENT
USING DECISION MAKING STRATEGIES
Christian Menard
University of Applied Sciences, Geoinformation,
Europastrasse 4, A-9524 Villach/St.Magdalen, Austria
Keywords: Spatial Decision Support System, Embedded GIS, Spatial Modeling, River Basin Management.
Abstract: The information needed for River Basin Management
covers a wide range of hydrological and
environmental data and methods. Since all measurement data are spatial and time related, spatial services
fulfill the requirements in a decision making process best. In this work an open data structure for storing
spatial temporal related data is proposed. Based on the data structure the modeling process can be performed
directly in a GIS environment by using visualization and spatial analysis techniques. This concept
incorporates the functions available in a GIS environment with the modeling concepts used in River Basin
Management. The paper concludes with experimental results and gives a short outlook to future work.
1 INTRODUCTION
The development and management of water
resources requires the simultaneous consideration of
numerous relationships and impacts such as water
quality, land use, rainfall, water storage, reservoir
management, irrigation, agricultural use,
groundwater, water supply, drinking water, and
pollution. There is a great interest for optimizing the
management of river basins, and there is the need for
coordination and integration of a large amount of
spatially related information and models for decision
making (Gunatilaka, 2003).
The information needed for River B
asin
Management (RBM) covers a wide range of
hydrological and environmental data and methods.
Several needs to meet these objectives have to be
fulfilled. Among those are commitments to
sustainable development, to support decisions for the
basin for environmental measures and to consider
diverse flood mitigation options. A Decision Support
System (DSS) thus contains tools to support
hydrologists in their decision making process. From
database management or information systems via
simulation models with mathematical programming
or optimization, almost any computer-based system
could support decisions.
In this work a concept is proposed which
co
mbines the functions available in a GIS
environment with modeling concepts used in RBM.
The advantage is that the construction of a model
can be performed directly within a GIS environment
using spatial services. Once the model is constructed
a simulation for a given situation in the river basin
can be performed. This approach can be used for
different kinds of calculations like precipitation run
off or even river quality monitoring. The fact that a
river system is based on network structure with
edges and nodes and connection rules each part of
the network can be based on a specific model.
Once a model is calculated all results can be
sto
red in a central database as time series data. This
gives different kinds of applications the possibility
to access these data through standard interfaces. The
results can be visualized and analyzed in the GIS
environment using standard functions.
2 ENVIRONMENTAL
INFORMATION SYSTEM
To support the modeling of hydrological events an
Environmental Information System (EIS) can serve
as the central unit.
An important aspect is how the measurement
d
ata are transferred to this central unit. In a river
basin all kinds of monitoring stations measuring
rainfall, river quality, industrial flow or water level
319
Menard C. (2005).
SPATIAL APPROACH IN RIVER BASIN MANAGEMENT USING DECISION MAKING STRATEGIES.
In Proceedings of the Second International Conference on Informatics in Control, Automation and Robotics, pages 319-322
Copyright
c
SciTePress
are located all over the basin. These monitoring
stations can be offline or online stations. At an
offline station the data are collected manually by
means of lists. Compared to offline stations, online
stations are directly connected to the central
database via telemetry network. As soon as, for
example, the water level in an online quantity station
is measured, the actual value together with the
timestamp is sent to the central unit.
Consisting of a set of digital maps, input, and
output forms, special tools for numerical and spatial
data analysis, plausibility control, visualization and
presentation the EIS guarantees the appropriate
handling and evaluation of all measurement data.
2.1 Spatial Temporal Data Storage
The EIS is planned to consist of a centralized state
of the art database management system, providing
functions necessary for storing, monitoring and
analyzing of data. The basic data structure should be
designed in an open standard, thus any application
can access these data using standard interfaces.
For each measurement it is important to know where
the measurement was made, what was measured and
when the measurement took place.
These spatial temporal data have to be stored in
such a way that each model can easily access the
data. A data structure for flexible data storage
consists of the following entities:
• Measurement Unit (MU)
• Measurement Parameter (MP)
• Time Series (TS)
• Measurement Data (MD)
Each MU has at least a unique identifier, a name,
a location and a description. This MU can have one
or many Measurement Parameters (MP) (or
measurement sensors). Each MP (sensor) records
Measurement Data, which have at least a timestamp,
location and the measured value.
An important aspect towards open systems is
that for each measurement at a MU for a certain MP
an entry in the MeasurementData table is created.
Using this kind of storage enables data access from
different kinds of external models or applications
without using middleware. Furthermore, this data
structure enables the extensibility of MU’s and
MP’s.
2.2 Plausibility Control
In an EIS the data themselves are of utmost
importance. For decision supporting purposes the
data have to be complete, correct and feasible. By
transferring data from online stations or manually to
the central database, these data can be corrupted due
to sensor errors or input failures. By using wrong
data the modeling process will be strongly affected,
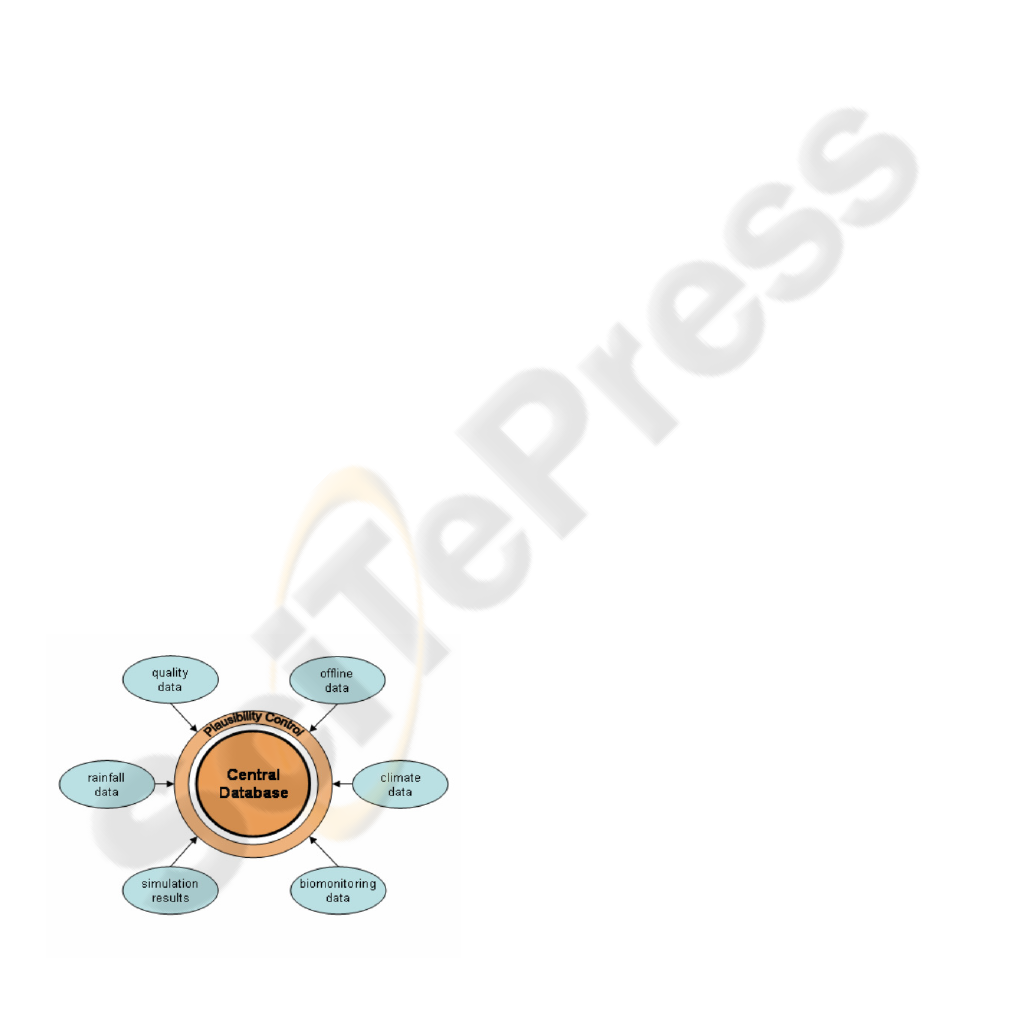
thus leading to wrong simulation results. In Figure 1
the data import through the plausibility layer from
different kinds of possible data sources is depicted.
In order to avoid passing wrong data to the
central database, a plausibility control is proposed.
Each entry of a measurement should pass this check.
A simple approach is to store a certain set of limits
that is used to inspect the measurement values for
each parameter. For each MP the following
attributes are possible:
• minimum threshold value,
• maximum threshold value,
• allowed deviation from the mean value
For special purposes a constant limit is not
sufficient, because the measurements for some MP’s
are time dependent. The limit values during the night
may differ from the daily limits.
In order to have temporal dependency these
limits can be modeled as a time series pair for upper
and lower boundary for each MP. These limits are
used to check the incoming data. Depending on
whether the measurements are within the allowed
range, the data are set to valid or invalid. Only valid
data are accepted for analysis and reporting.
2.3 Spatial Data Retrieval
A Geographic Information System (GIS)
incorporates all necessary tools for visualizing and
analyzing geographically related data. Results of
queries can be visualized directly on a map and data
from different geographic related assignments like
catchments areas can be handled.
Figure 1: Different kinds of possible data sources
ICINCO 2005 - INTELLIGENT CONTROL SYSTEMS AND OPTIMIZATION
320
An EIS should combine all necessary tools for
managing and analyzing data in the central database.
All clients have the possibility to retrieve all kinds of
data from different sources (quality data, simulation
results, climate data, etc.) from this database. An
important aspect towards interoperability is that
spatial related data are stored in a database which
supports Open GIS technology defined by the Open
Geospatial Consortium (OGC) (OGC, 2005).
All data in an EIS are related to spatial temporal
information, thus all monitoring stations, catchment
areas, river reaches etc. can be visualized and
analyzed in a GIS.
Since a MU has a spatial reference which can be
static (online measurement unit) or even dynamic
(mobile measurement unit) it can be visualized on a
map using spatial services. A river network consists
of nodes and edges and relations to catchments or
reservoirs. A node, for, instance, can be a junction or
diversion, whereas an edge can be a river reach, a
channel, etc. In Table 1 different possible spatial
representations of a MU are shown. In a river
network it is evident that each network node, edge or
region has the possibility to store time series data.
Table 1: Different kinds of spatial representations
Representation Objects in a river network
point source, junction, diversion, etc.
polyline river segment, channel, etc.
polygon catchment, reservoir, etc.
3 SPATIAL DECISION SUPPORT
SYSTEM
Basically, a Spatial Decision Support System
(SDSS) attempts to provide the water-resources
managers with analytical assistance based on spatial
information in making rational choices based on
objective assessment, thereby reducing the element
of subjective opinion (Gunatilaka, 2001),
Malczewski, 1999). This requires a broader
approach, which is otherwise limited within the
narrow realms of hydrology and water resources.
For the decision making process there is the need to
include spatial and quantitative information
wherever possible on economical and environmental
considerations (Clemen, 1996). Therefore, an SDSS
can be regarded as form of artificial intelligence in
which computers are used not only to predict, what
is likely to happen given various assumptions, but
mainly to supplement management experience in
decision-making.
3.1 Spatial Modeling
The first step towards a SDSS is to describe
processes and data by means of hydrological,
hydraulic, sediment transport, meteorological and
ecological models. These models have to be
integrated into general decision making approaches.
Integrated mathematical computer models
comprising hydrological models, hydraulic models,
flood forecasting models, water balance models,
water resources management and reservoir
optimization models as well as water quality models
are in themselves tools that support decision making.
In order to transform the outputs from these models
into practical decisions, they need to be combined
with other type of information, such as details of
infrastructure, possibilities for control, spatial
information etc. In an SDSS these tools combined
with spatial data can be integrated in a GIS
environment. A model can be an internal model,
which runs on the same machine in the decision
support environment, or an external model, which is
an external application like HEC-1 or HEC-HMS
(Cunge, 1992). Important for an external model is
that a preprocessor prepares the data necessary for
the external model and a post processing task which
retrieves the result data back to the central database
(Fürst, 2005).
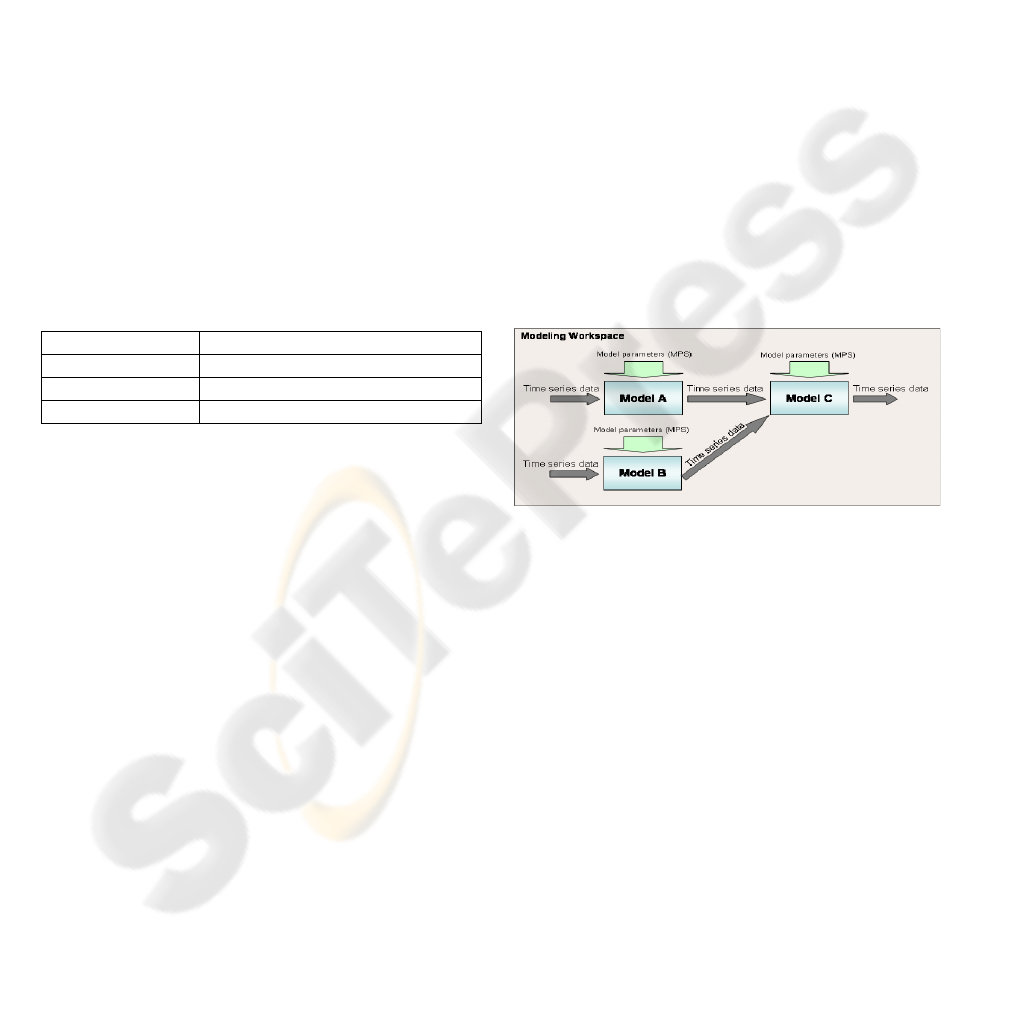
Figure 2: Modeling Workspace.
A model can be controlled by means of model
parameters. A Model Parameter Set (MPS) contains
all attributes necessary to initialize and control a
model calculation. As input data for a model
calculation all time series data in the EIS are valid.
After successful calculation of a model the results
are stored again as time series data. One model can
be defined as network and can have one or more
predecessor and one or more successor models.
Using this principle, different models are using time
series data from the EIS. All connected models
together with the MPS’s build up a Modeling
Workspace (MW), which is depicted schematically
in Figure 2.
SPATIAL APPROACH IN RIVER BASIN MANAGEMENT USING DECISION MAKING STRATEGIES
321
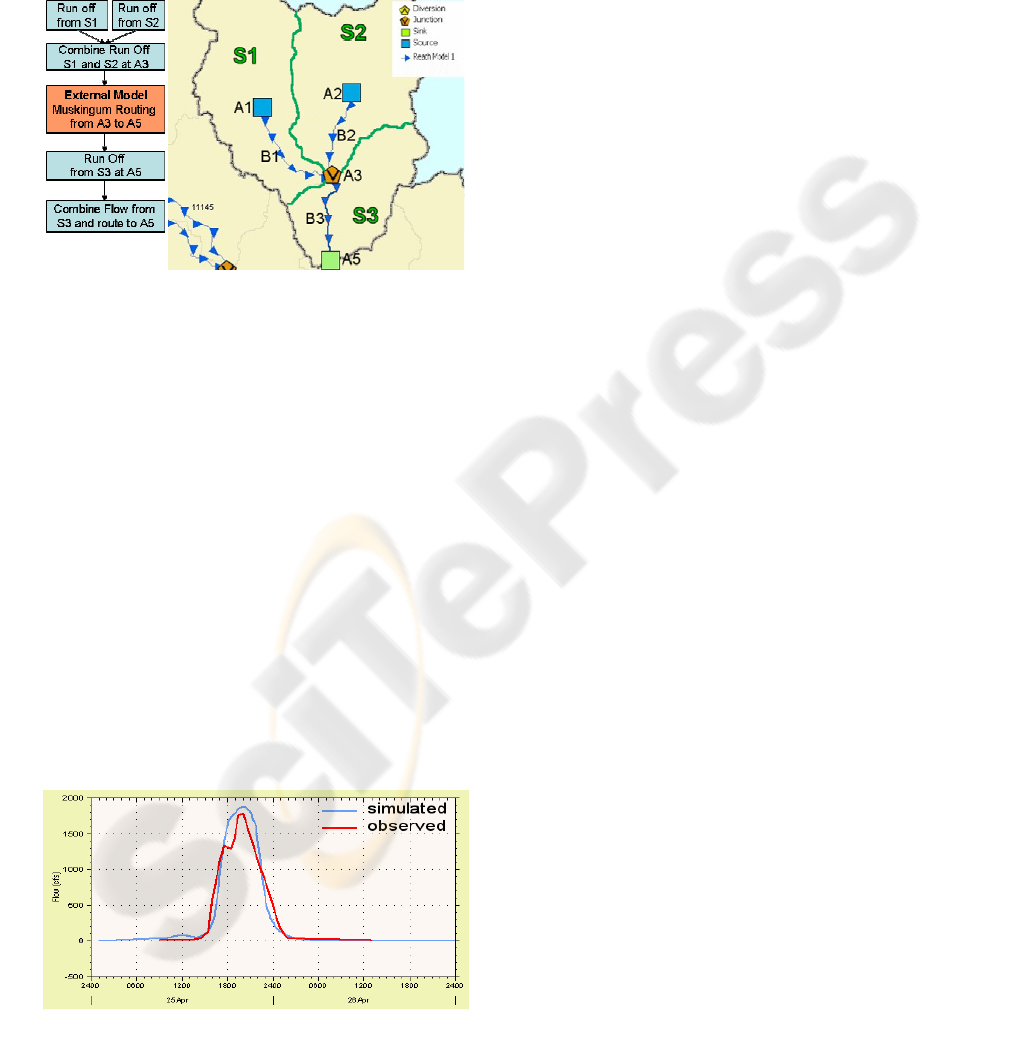
3.2 Simulation Results
When starting a MW, a Simulation Run (SR) is
created. Each model in the MW is started in respect
to its correct order. A model can only be started if
the necessary input data are already calculated by
the previous model. In this example a precipitation
run off simulation is used. The area of the MW
consists of three sub basins S1-S3 two sources A1,
A2 one junction A3, a sink A5 and three reaches B1-
B3 (see Figure 3). As river reach several models can
be used like Simple Lag, Modified Puls,
Muskingum, etc. In this example the Muskingum
routing model was used for the reach B3.
First the run off from the two sub basins S1 and
S2 are calculated and combined at the junction A3.
Next an external calculation of Muskingum routing
from A3 to the sink A5 is performed using HEC
routines. Finally the run off from S3 is calculated
and combined with the routed flow to the sink A5.
One MW can be started for different MPS’s,
thus resulting in several simulation results. The MW
can be represented directly in a GIS environment
(see Figure 3).
In Figure 4 the results of a simulation run is
presented where the simulated flow at sink A5 can
be visualized as time series. In addition to the
simulated flow the observed flow can be displayed.
4 CONCLUSION AND OUTLOOK
An Environmental Information System contains tools
to manage data from online or offline monitoring
stations in a river basin. All data in a river basin are
spatial temporal related. GIS functions and external
tools can be combined for hydrologic modeling and
will support hydrologic experts in decision finding
processes.
Future work will concentrate on concepts for
integrating digital elevation models (DEM) for
watershed management, thus allowing stream and
sub basin delineation.
REFERENCES
Clemen, Robert T. (1996). Making Hard Decisions: An
Introduction to Decision Analysis, 2nd Edition,
Duxbury Press, Belmont, CA.
Cunge, J.A., Erlich, M., Negre, J.L. and Rahuel, J. L.
(1992). Construction and assessment of flood
forecasting scenarios in the hydrological forecasting
system HFS/SPH. Proc. BHR Group 3rd Internat. Conf.
on Floods and Flood Management, Florence, Kluwer
Academic, pp 291-312.
Figure 3: Modelling Workspace for a preci
p
itation run of
f
model
Gunatilaka, A., Dreher, J. & Pitono, J (2001). River basin
management strategies for Indonesia – Extension of
the Brantas model to Central Java, Proc. International
Water Association Conference on ‘Water & Waste-
water Management for Developing Countries’, October
2001, Kuala Lumpur, pp 360 –369.
Gunatilaka A., Dreher J. (2003), Use of real-time data in
environmental monitoring: current practices, Water
Science & Technology Vol 47 No 2, pp 53–61.
Malczewski J
.,(1999), GIS and Multicriteria Decision
Analysis
, New York, Wiley, John & Sons,
Incorporated.
Fürst (2004), GIS in Hydrologie und Wasserwirtschaft,
Wichmann Verlag, Heidelberg.
OCG (2005), http://www.opengeospatial.org.
Figure 4: Observed and simulated flow at sink A5.
ICINCO 2005 - INTELLIGENT CONTROL SYSTEMS AND OPTIMIZATION
322
